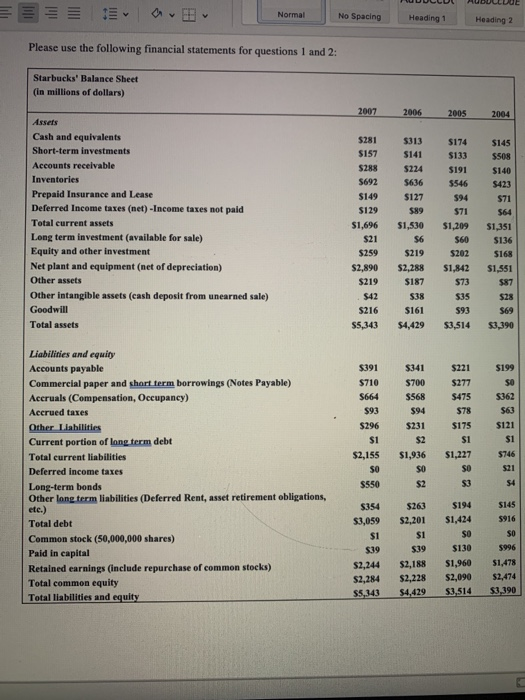
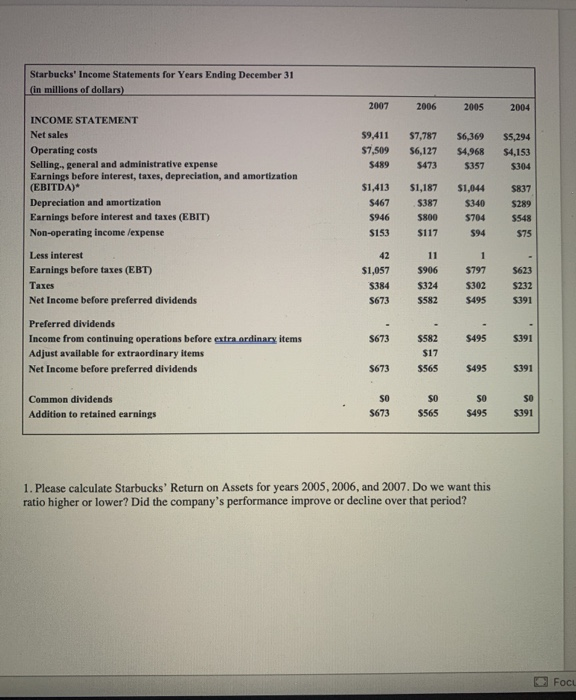
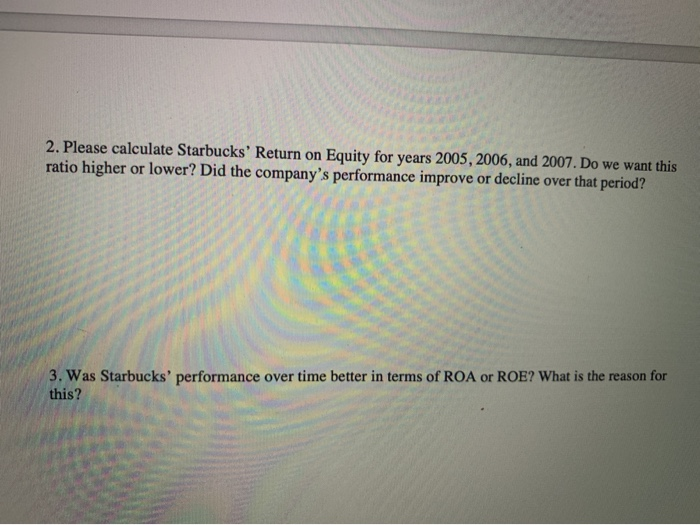
Normal No Spacing Heading 1 Heading 2 Please use the following financial statements for questions 1 and 2: Starbucks' Balance Sheet (in millions of dollars) 2007 2006 2005 2004 Assets Cash and equivalents Short-term investments Accounts receivable Inventories Prepaid Insurance and Lease Deferred Income taxes (net) -Income taxes not pald Total current assets Long term investment (available for sale) Equity and other investment Net plant and equipment (net of depreciation) Other assets Other intangible assets (cash deposit from unearned sale) Goodwill Total assets $281 $157 $288 S692 $149 $129 $1,696 $21 $259 $2.890 $219 $42 $216 $5,343 $313 $141 5224 $636 $127 $89 $1,530 $6 $219 $2,288 S187 538 $161 $4,429 $174 $133 $191 $546 $94 $71 $1,209 $60 $202 $1,842 $73 $35 $93 $3,514 $145 $508 $140 $423 $71 $64 $1,351 S136 $168 $1,551 $87 $28 569 $3,390 $341 $700 $568 $94 $391 $710 S664 $93 5296 $1 $2,155 SO $550 $199 SO 5362 $63 $121 $1 Liabilities and equity Accounts payable Commercial paper and short term borrowings (Notes Payable) Accruals (Compensation, Occupancy) Accrued taxes Other Liabilities Current portion of long term debt Total current liabilities Deferred income taxes Long-term bonds Other long term liabilities (Deferred Rent, asset retirement obligations, etc.) Total debt Common stock (50,000,000 shares) Paid in capital Retained earnings (include repurchase of common stocks) Total common equity Total liabilities and equity $221 5277 $475 $78 $175 $1 $1,227 SO S3 $231 $2 $1,936 SO $2 $746 521 54 $145 5916 $354 $3,059 S1 $39 $2,244 $2,284 $5,343 $263 $2,201 $1 $39 $2,188 $2,228 $4.429 $194 S1,424 SO $130 $1,960 $2,090 $3,514 SO $996 $1,478 $2,474 $3.390 Starbucks' Income Statements for Years Ending December 31 (in millions of dollars) 2007 2006 2005 2004 59,411 $7,509 $489 $7,787 $6,127 $473 S6,369 $4,968 $357 $5,294 $4,153 $304 INCOME STATEMENT Net sales Operating costs Selling., general and administrative expense Earnings before interest, taxes, depreciation, and amortization (EBITDA)" Depreciation and amortization Earnings before interest and taxes (EBIT) Non-operating income /expense $1,413 $467 $946 $153 $1,187 $387 $800 $117 $1,044 $340 $704 $94 $837 $289 $548 $75 42 $1,057 5384 $673 11 $906 $324 5582 $797 S302 $495 5623 $232 5391 Less interest Earnings before taxes (EBT) Taxes Net Income before preferred dividends Preferred dividends Income from continuing operations before extra ordinary items Adjust available for extraordinary items Net Income before preferred dividends S673 $495 $391 $582 $17 $565 $673 $495 5391 Common dividends Addition to retained earnings so $673 SO $565 SO $495 so $391 1. Please calculate Starbucks' Return on Assets for years 2005, 2006, and 2007. Do we want this ratio higher or lower? Did the company's performance improve or decline over that period? Focu 2. Please calculate Starbucks' Return on Equity for years 2005, 2006, and 2007. Do we want this ratio higher or lower? Did the company's performance improve or decline over that period? 3. Was Starbucks' performance over time better in terms of ROA or ROE? What is the reason for this


