Not 1
I need all steps
I will submit ur answer in turnitin assignment
Not 2
I don't want to write handwriting
S , Alh
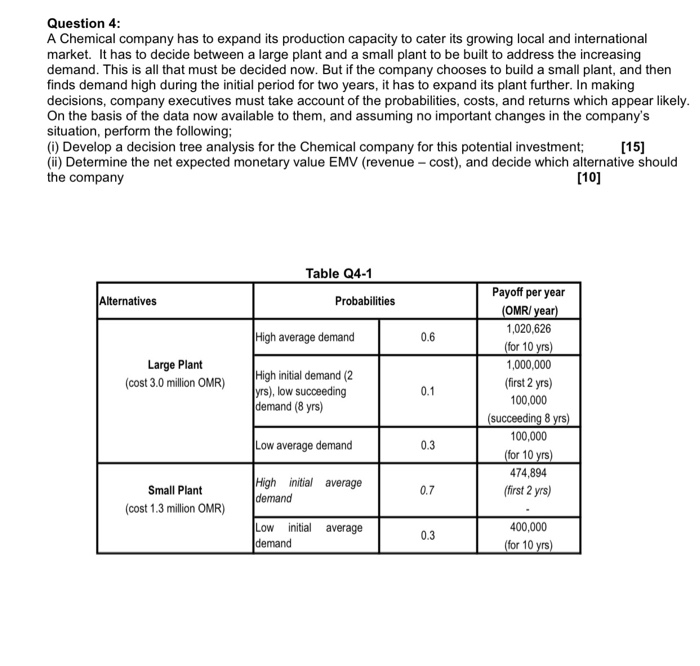
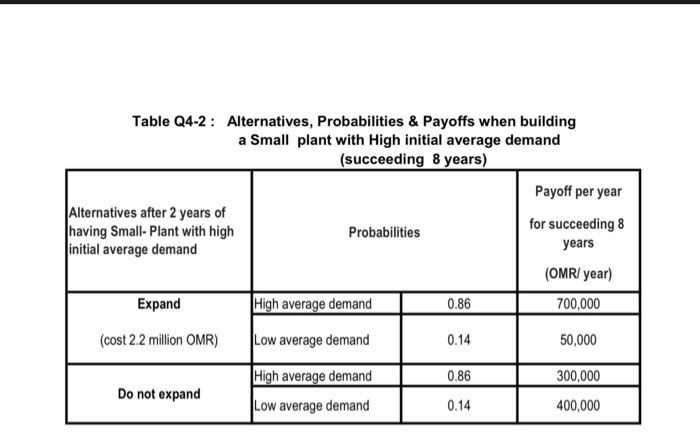
Question 4: A Chemical company has to expand its production capacity to cater its growing local and international market. It has to decide between a large plant and a small plant to be built to address the increasing demand. This is all that must be decided now. But if the company chooses to build a small plant, and then finds demand high during the initial period for two years, it has to expand its plant further. In making decisions, company executives must take account of the probabilities, costs, and returns which appear likely. On the basis of the data now available to them, and assuming no important changes in the company's situation, perform the following: (i) Develop a decision tree analysis for the Chemical company for this potential investment; [15] (ii) Determine the net expected monetary value EMV (revenue - cost), and decide which alternative should the company [10] Table Q4-1 Alternatives Probabilities High average demand 0.6 Large Plant (cost 3.0 million OMR) High initial demand (2 yrs), low succeeding demand (8 yrs) Payoff per year (OMR/ year) 1,020,626 (for 10 yrs) 1,000,000 (first 2 yrs) 100,000 (succeeding 8 yrs) 100,000 (for 10 yrs) 474,894 (first 2 yrs) Low average demand 0.3 average High initial demand Small Plant (cost 1.3 million OMR) 0.7 Low initial demand average 0.3 400,000 (for 10 yrs) Table Q4-2: Alternatives, Probabilities & Payoffs when building a Small plant with High initial average demand (succeeding 8 years) Payoff per year Alternatives after 2 years of having Small-Plant with high initial average demand Probabilities for succeeding 8 years (OMR/ year) Expand High average demand 0.86 700,000 (cost 2.2 million OMR) Low average demand 0.14 50,000 300,000 Do not expand High average demand Low average demand 0.86 0.14 400,000 Question 4: A Chemical company has to expand its production capacity to cater its growing local and international market. It has to decide between a large plant and a small plant to be built to address the increasing demand. This is all that must be decided now. But if the company chooses to build a small plant, and then finds demand high during the initial period for two years, it has to expand its plant further. In making decisions, company executives must take account of the probabilities, costs, and returns which appear likely. On the basis of the data now available to them, and assuming no important changes in the company's situation, perform the following: (i) Develop a decision tree analysis for the Chemical company for this potential investment; [15] (ii) Determine the net expected monetary value EMV (revenue - cost), and decide which alternative should the company [10] Table Q4-1 Alternatives Probabilities High average demand 0.6 Large Plant (cost 3.0 million OMR) High initial demand (2 yrs), low succeeding demand (8 yrs) Payoff per year (OMR/ year) 1,020,626 (for 10 yrs) 1,000,000 (first 2 yrs) 100,000 (succeeding 8 yrs) 100,000 (for 10 yrs) 474,894 (first 2 yrs) Low average demand 0.3 average High initial demand Small Plant (cost 1.3 million OMR) 0.7 Low initial demand average 0.3 400,000 (for 10 yrs) Table Q4-2: Alternatives, Probabilities & Payoffs when building a Small plant with High initial average demand (succeeding 8 years) Payoff per year Alternatives after 2 years of having Small-Plant with high initial average demand Probabilities for succeeding 8 years (OMR/ year) Expand High average demand 0.86 700,000 (cost 2.2 million OMR) Low average demand 0.14 50,000 300,000 Do not expand High average demand Low average demand 0.86 0.14 400,000