

Answered step by step
Verified Expert Solution
Question
1 Approved Answer
not (20 points) The table in the next page is Table 7 of Lakonishok, Shleifer, and Vishny (1994). Please explain the purposes of this table
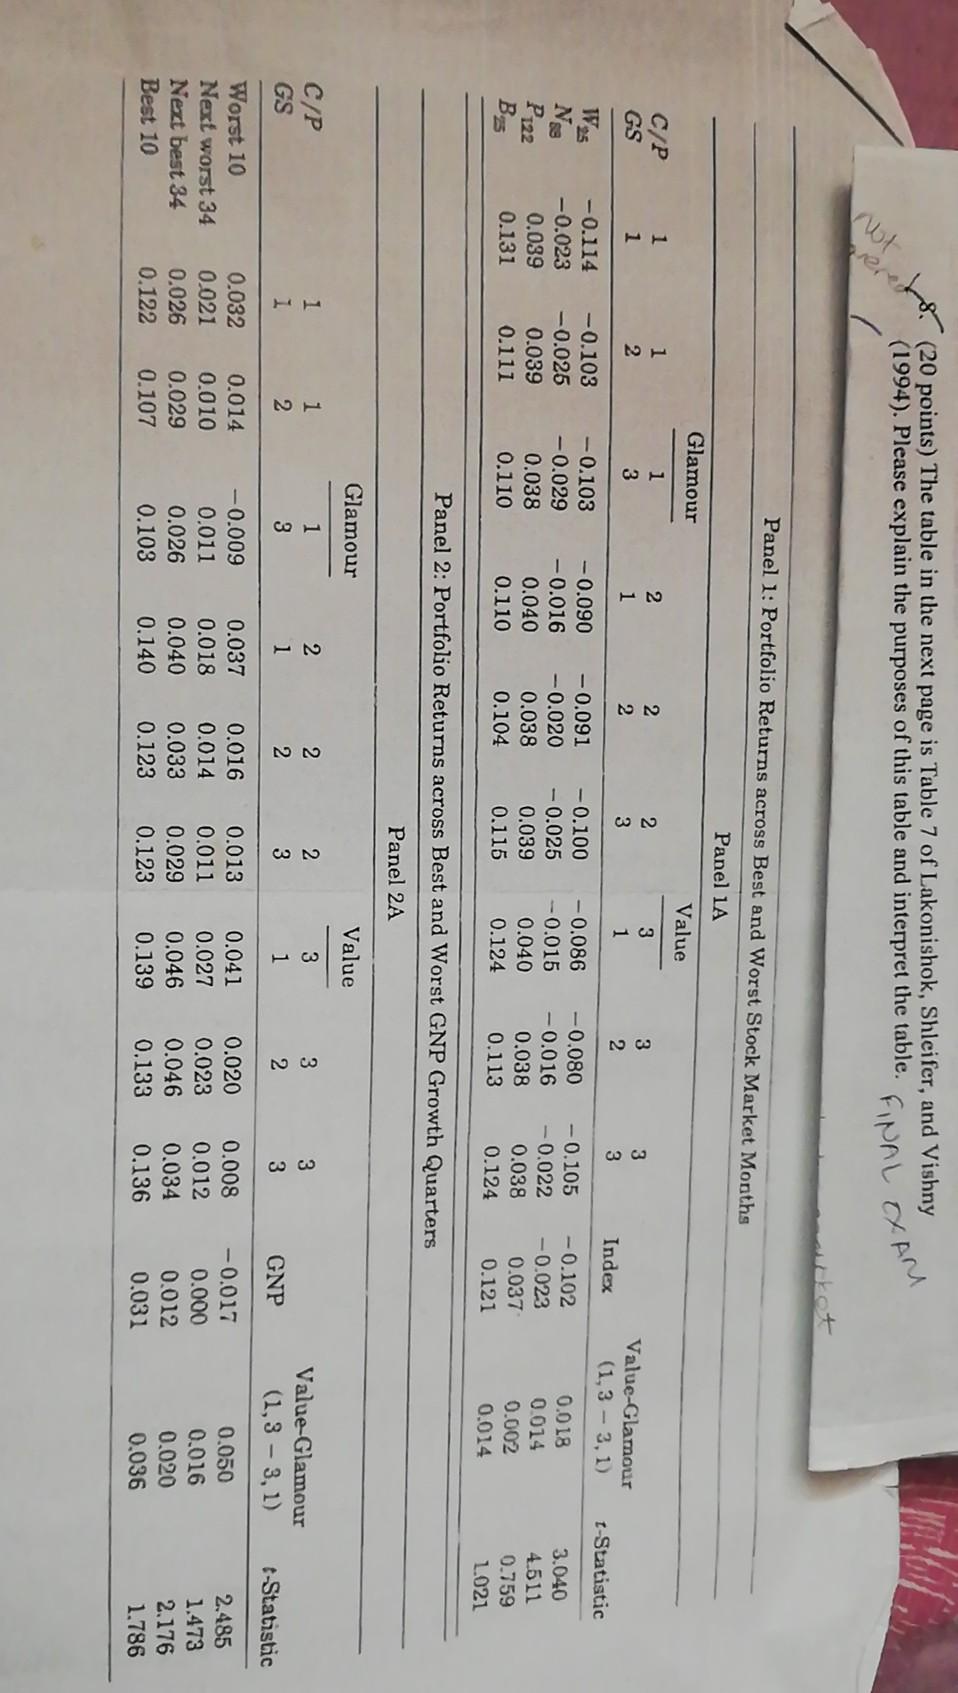
not (20 points) The table in the next page is Table 7 of Lakonishok, Shleifer, and Vishny (1994). Please explain the purposes of this table and interpret the table. FINAL XAM Panel 1: Portfolio Returns across Best and Worst Stock Market Months Panel 1A Glamour Value 1 C/P GS 1 2 2 1 2 2 2 3 1 3 1 3 2 Index Value-Glamour (1,3 - 3,1) I-Statistic 125 Nse P122 BE -0.114 -0.023 0.039 0.131 -0.103 -0.025 0.039 0.111 -0.103 -0.029 0.038 0.110 -0.090 -0.016 0.040 0.110 -0.091 -0.020 0.038 0.104 -0.100 -0.025 0.039 0.115 -0.086 -0.015 0.040 0.124 -0.080 -0.016 0.038 0.113 - 0.105 -0.022 0.038 0.124 -0.102 -0.023 0.037 0.121 0.018 0.014 0.002 0.014 3.040 4.511 0.759 1021 Panel 2: Portfolio Returns across Best and Worst GNP Growth Quarters Panel 2A Glamour Value 1 1 2 2 3 3 C/P GS 3 1 1 2 3 2 3 1 2 1 2 3 GNP Value-Glamour (1,3 -3,1) -Statistic 0.014 0.016 0.013 0.011 Worst 10 Next worst 34 Next best 34 Best 10 0.032 0.021 0.026 0.122 0.010 0.029 0.107 -0.009 0.011 0.026 0.103 0.037 0.018 0.040 0.140 0.014 0.033 0.123 0.041 0.027 0.046 0.139 0.020 0.023 0.046 0.133 0.008 0.012 0.034 0.136 0.029 0.123 -0.017 0.000 0.012 0.031 0.050 0.016 0.020 0.036 2.485 1.473 2.176 1.786 (20 points) The table in the next page is Table 7 of Lakonishok, Shleifer, and Vishny (1994). Please explain the purposes of this table and interpret the table. FINAL EX not (20 points) The table in the next page is Table 7 of Lakonishok, Shleifer, and Vishny (1994). Please explain the purposes of this table and interpret the table. FINAL XAM Panel 1: Portfolio Returns across Best and Worst Stock Market Months Panel 1A Glamour Value 1 C/P GS 1 2 2 1 2 2 2 3 1 3 1 3 2 Index Value-Glamour (1,3 - 3,1) I-Statistic 125 Nse P122 BE -0.114 -0.023 0.039 0.131 -0.103 -0.025 0.039 0.111 -0.103 -0.029 0.038 0.110 -0.090 -0.016 0.040 0.110 -0.091 -0.020 0.038 0.104 -0.100 -0.025 0.039 0.115 -0.086 -0.015 0.040 0.124 -0.080 -0.016 0.038 0.113 - 0.105 -0.022 0.038 0.124 -0.102 -0.023 0.037 0.121 0.018 0.014 0.002 0.014 3.040 4.511 0.759 1021 Panel 2: Portfolio Returns across Best and Worst GNP Growth Quarters Panel 2A Glamour Value 1 1 2 2 3 3 C/P GS 3 1 1 2 3 2 3 1 2 1 2 3 GNP Value-Glamour (1,3 -3,1) -Statistic 0.014 0.016 0.013 0.011 Worst 10 Next worst 34 Next best 34 Best 10 0.032 0.021 0.026 0.122 0.010 0.029 0.107 -0.009 0.011 0.026 0.103 0.037 0.018 0.040 0.140 0.014 0.033 0.123 0.041 0.027 0.046 0.139 0.020 0.023 0.046 0.133 0.008 0.012 0.034 0.136 0.029 0.123 -0.017 0.000 0.012 0.031 0.050 0.016 0.020 0.036 2.485 1.473 2.176 1.786 (20 points) The table in the next page is Table 7 of Lakonishok, Shleifer, and Vishny (1994). Please explain the purposes of this table and interpret the table. FINAL EX
Step by Step Solution
There are 3 Steps involved in it
Step: 1

Get Instant Access to Expert-Tailored Solutions
See step-by-step solutions with expert insights and AI powered tools for academic success
Step: 2

Step: 3
Ace Your Homework with AI
Get the answers you need in no time with our AI-driven, step-by-step assistance
Get Started
How To Trade Stocks For A Living The Ultimate 4 Book Compilation
Authors: Mark Lowe
1st Edition
B08BQRC9S5