Question: Not 8 pages sorry . 10:24 4. Task1 Guidance Notes v International Strategic Management Assignment Things to Note When Completing Task 1 The Assignment 1
Not 8 pages sorry .


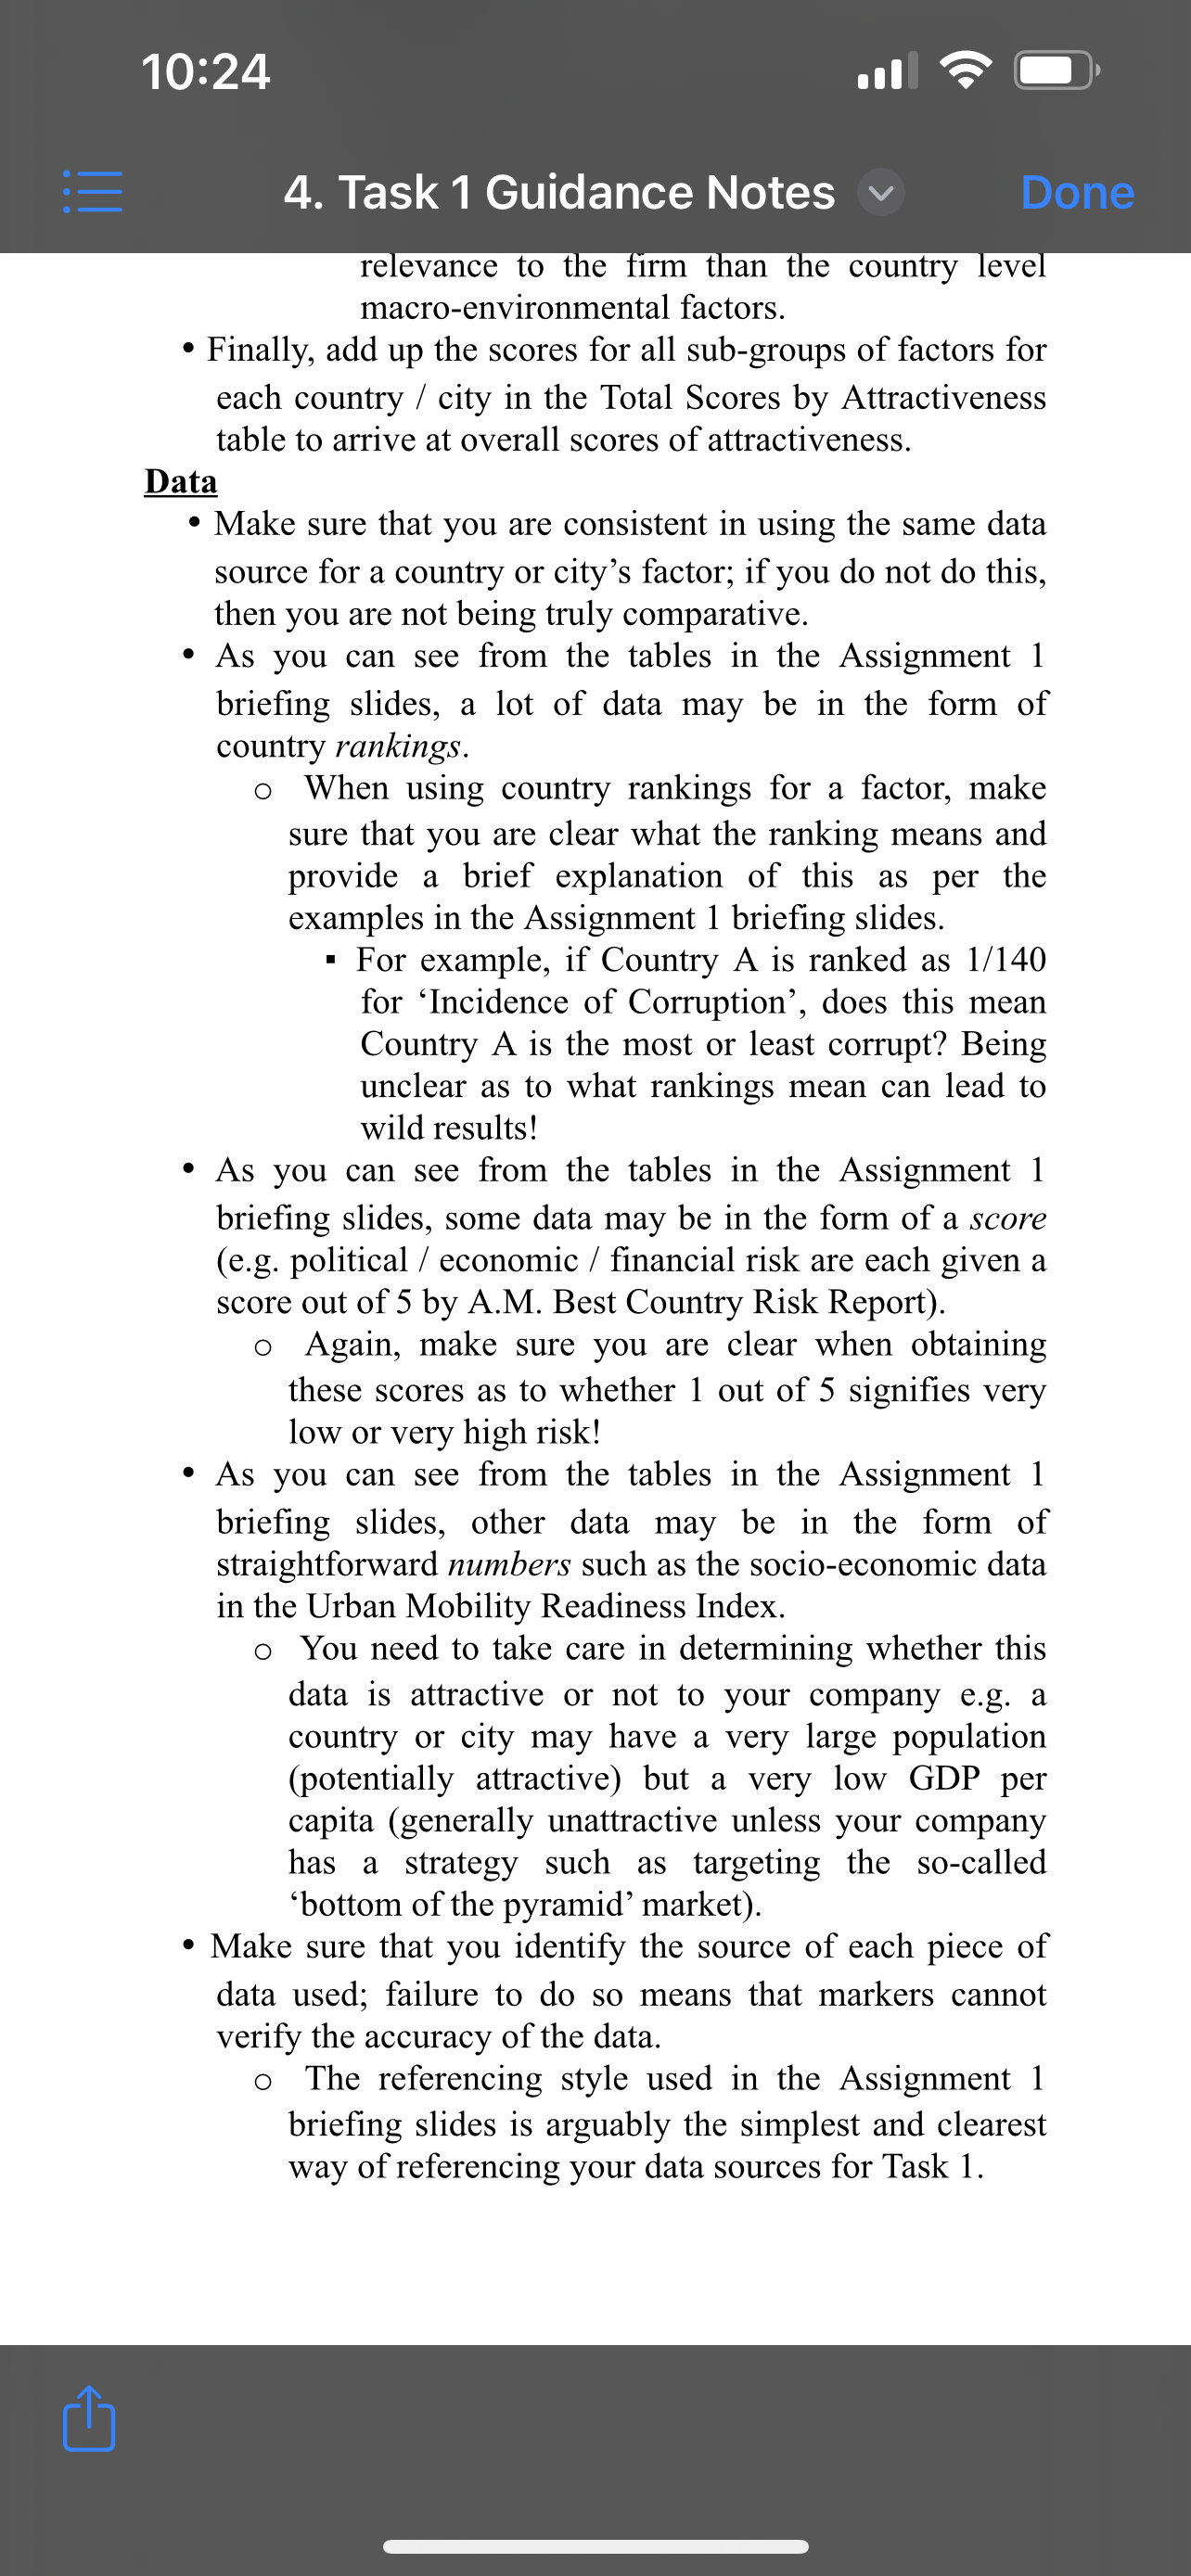

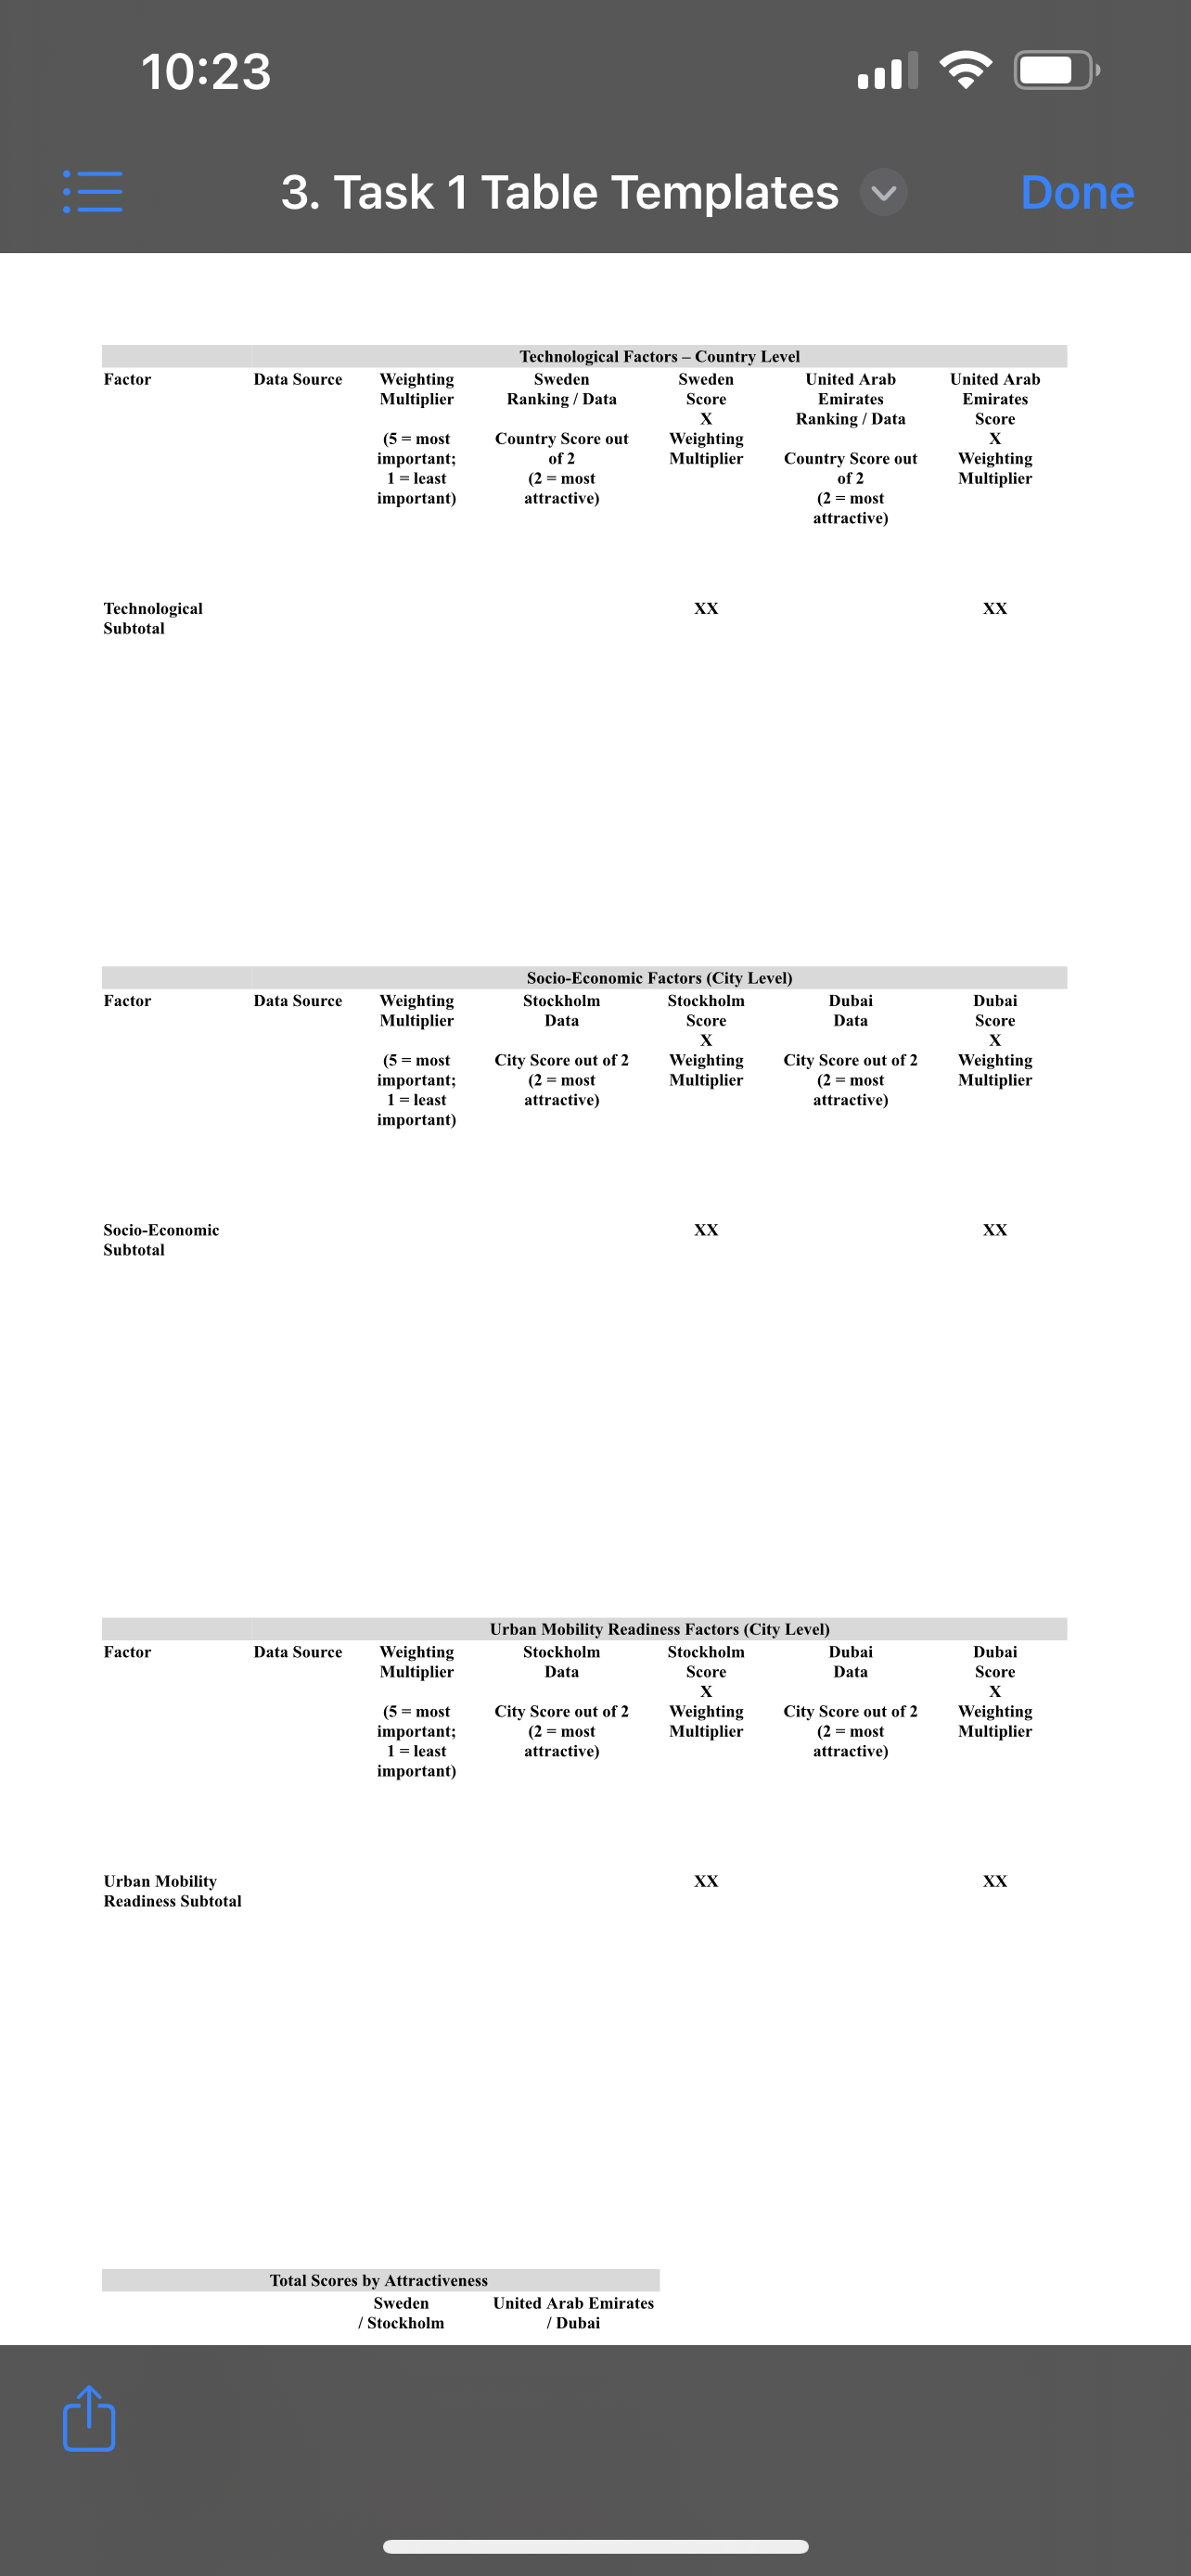
10:24 4. Task1 Guidance Notes v International Strategic Management Assignment Things to Note When Completing Task 1 The Assignment 1 brieng slides are intended only as an illustrative example to show: 0 how data can be compared across 2 countries / cities on a like-forlike basis, using the same sources 0 how the 2 countries / cities can be scored in terms of their overall attractiveness o & please do not take the example slides literally_! Task 1 Table Templa You must use the table templates provided Iggy/our tutors. Focus Remember that while a country's national macro- environment provides an important wider context for this assignment, you will also need to narrow your evaluation down to the city-level 0 because urban mobility is typically addressed at city level rather than at country level. ' You must identify those country-level and city-level factors that are relevant to your company. 0 For example, do you really think that a factor such as 'exposure to unsafe drinking water' is of direct relevance to SEAT's deciding in which city to launch the 'Minimo'? Process 0 Having identied the countrylevel and city-level factors that are relevant to SEAT, you need to decide on their relative importance to the company in order to assign a weighting to them. 0 Think carefully about why some factors may be of greater importance to SEAT than others. ' Once you have decided upon the relative weightings for a sub-group of factors (e. g. political factors), then enter the data for each country (or city). You are only comparing 2 countries / cities. Therefore, once you have decided which country (or city) has the more attractive ranking / score / numerical data for a particular factor, award that country (or city) a score of 2; award a score of 1 for the other country (or city) for the same factor. 0 Then multiply the score awarded to each country (or city) by the weighting multiplier that you have given to that particular factor. ' Once this process has been completed for a sub-group of 4. Task1 Guidance Notes v 0 Then multiply the score awarded to each country (or city) by the weighting multiplier that you have given to that particular factor. ' Once this process has been completed for a sub-group of factors (eg. political factors), total up the scores for each country (or city). 0 Repeat the same process again for the next sub- group of factors (eg. legal factors) until you have scores for all 5 sub-groups of factors. 0 Once you have undertaken the above process for both country-level factors (Political, Legal, Economic and Technological) and for citylevel factors (Socio Economic and Urban Mobility Readiness), present a table of Total Scores by Attractiveness; add the scores for each of the 5 groups of subfactors for each country and city into this table. 0 Then multiply the SocioEconomic and Urban Mobility Readiness total scores for each city by a weighting of 1.5. - Remember, urban mobility is typically addressed at city level rather than at country level; therefore, city-level socio-economic and urban mobility factors need to be given a weighting to reect their more immediate relevance to the firm than the country level macro-environmental factors. ' Finally, add up the scores for all subgroups of factors for each country / city in the Total Scores by Attractiveness table to arrive at overall scores of attractiveness. Data ' Make sure that you are consistent in using the same data source for a country or city's factor; if you do not do this, then you are not being truly comparative. 0 As you can see from the tables in the Assignment 1 brieng slides, a lot of data may be in the form of country rankings. 0 When using country rankings for a factor, make sure that you are clear what the ranking means and provide a brief explanation of this as per the examples in the Assignment 1 brieng slides. - For example, if Country A is ranked as 1/140 for 'Incidence of Corruption', does this mean Country A is the most or least corrupt? Being unclear as to what rankings mean can lead to wild results! ' As you can see from the tables in the Assignment 1 brieng slides, some data may be in the form of a score (e. g. political / economic / nancial risk are each given a _A. -.L'f1__\\ 111' n- ('1-...A..__n..1_n-.._.4\\ 10:24 4. Task1 Guidance Notes v re evance to t e irm t an t e country eve macro-environmental factors. - Finally, add up the scores for all subgroups of factors for each country / city in the Total Scores by Attractiveness table to arrive at overall scores of attractiveness. Data ' Make sure that you are consistent in using the same data source for a country or city's factor; if you do not do this, then you are not being truly comparative. As you can see from the tables in the Assignment 1 brieng slides, a lot of data may be in the form of country rankings. 0 When using country rankings for a factor, make sure that you are clear What the ranking means and provide a brief explanation of this as per the examples in the Assignment 1 brieng slides. - For example, if Country A is ranked as 1/140 for 'Incidence of Corruption', does this mean Country A is the most or least corrupt? Being unclear as to What rankings mean can lead to wild results! As you can see from the tables in the Assignment 1 brieng slides, some data may be in the form of a score (e.g. political / economic / nancial risk are each given a score out of 5 by AM. Best Country Risk Report). 0 Again, make sure you are clear when obtaining these scores as to whether 1 out of 5 signies very low or very high risk! As you can see from the tables in the Assignment 1 brieng slides, other data may be in the form of straightforward numbers such as the socioeconomic data in the Urban Mobility Readiness Index. 0 You need to take care in determining whether this data is attractive or not to your company e.g. a country or city may have a very large population (potentially attractive) but a very low GDP per capita (generally unattractive unless your company has a strategy such as targeting the so-called 'bottom of the pyramid' market). ' Make sure that you identify the source of each piece of data used; failure to do so means that markers cannot verify the accuracy of the data. 0 The referencing style used in the Assignment 1 brieng slides is arguably the simplest and clearest way of referencing your data sources for Task 1. International Strategic Management Assignment Things to Note When Completing Task 1 The Assignment 1 brieng slides are intended only as an illustrative example to show: 0 how data can be compared across 2 countries / cities on a like-forlike basis, using the same sources 0 how the 2 countries / cities can be scored in terms of their overall attractiveness o & please do not take the example slides literally_! Task 1 Table Templa You must use the table templates provided by_your tutors. Focus Remember that while a country's national macro- environment provides an important wider context for this assignment, you will also need to narrow your evaluation down to the city-level 0 because urban mobility is typically addressed at city level rather than at country level. - You must identify those country-level and city-level factors that are relevant to your company. 0 For example, do you really think that a factor such as 'exposure to unsafe drinking water' is of direct relevance to SEAT's deciding in which city to launch the 'Minimo'? Process - Having identied the country-level and city-level factors that are relevant to SEAT, you need to decide on their relative importance to the company in order to assign a weighting to them. 0 Think carefully about why some factors may be of greater importance to SEAT than others. ' Once you have decided upon the relative weightings for a sub-group of factors (e.g. political factors), then enter the data for each country (or city). ' You are only comparing 2 countries / cities. Therefore, once you have decided which country (or city) has the more attractive ranking / score / numerical data for a particular factor, award that country (or city) a score of 2; award a score of l for the other country (or city) for the same factor. 0 Then multiply the score awarded to each country (or city) by the weighting multiplier that you have given to that particular factor. ' Once this process has been completed for a sub-group of factors (e.g. political factors), total up the scores for each country (or city). 10:23 3. Task 1 Table Templates V Done Technological Factors - Country Level Factor Data Source Weighting Sweden Sweden United Arab United Arab Multiplier Ranking / Data Score Emirates Emirates X Ranking / Data Score (5 = most Country Score out Weighting X important of Multiplier Country Score out Weighting 1 = least (2 = most of 2 Multiplier important) attractive) (2 = most attractive) XX Technological XX Subtotal Socio-Economic Factors (City Level) Factor Data Source Weighting Stockholm Stockholm Dubai Dubai Multiplier Data Score Data Score X X (5 = most City Score out of 2 Weighting City Score out of 2 Weighting important; (2 = mo Multiplier (2 = most Multiplier 1 = least attractive) attractive) important) XX Socio-Economic XX Subtotal Urban Mobility Readiness Factors (City Level) Dubai Factor Data Source Weighting Stockholm Stockholm Dubai Multiplier Data Score Data Score X (5 = most City Score out of 2 Weighting City Score out of 2 Weighting important (2 = most Multiplier (2 = most Multiplier 1 = least attractive) attractive) important) Urban Mobility XX XX Readiness Subtotal Total Scores by Attractiveness Sweden United Arab Emirates Stockholm Dubai
Step by Step Solution
There are 3 Steps involved in it

Get step-by-step solutions from verified subject matter experts


