

Question
Note: Assume alpha=0.05 for all questions. P1. A twofactor analysis of variance (Twoway ANOVA) is an inferential statistical test that allows us to examine if
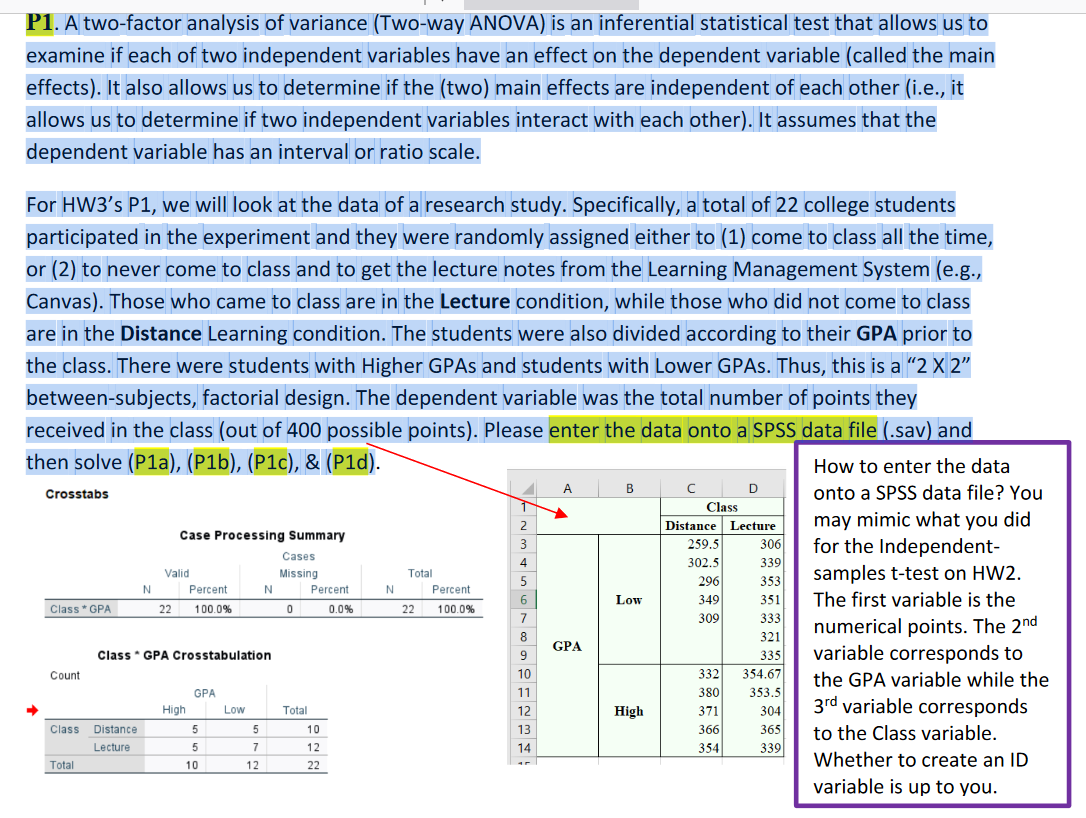
Note: Assume alpha=0.05 for all questions. P1. A twofactor analysis of variance (Twoway ANOVA) is an inferential statistical test that allows us to examine if each of two independent variables have an effect on the dependent variable (called the main effects). It also allows us to determine if the (two) main effects are independent of each other (i.e., it allows us to determine if two independent variables interact with each other). It assumes that the dependent variable has an interval or ratio scale. For HW3's P1, we will look at the data of a research study. Specifically, a total of 22 college students participated in the experiment and they were randomly assigned either to (1) come to class all the time, or (2) to never come to class and to get the lecture notes from the Learning Management System (e.g., Canvas). Those who came to class are in the Lecture condition, while those who did not come to class are in the Distance Learning condition. The students were also divided according to their GPA prior to the class. There were students with Higher GPAs and students with Lower GPAs. Thus, this is a "2 X 2" betweensubjects, factorial design. The dependent variable was the total number of points they received in the class (out of 400 possible points). Please enter the data onto a SPSS data file (.sav) and then solve (P1a), (P1b), (P1c), & (P1d)
Step by Step Solution
There are 3 Steps involved in it
Step: 1

Get Instant Access to Expert-Tailored Solutions
See step-by-step solutions with expert insights and AI powered tools for academic success
Step: 2

Step: 3
Ace Your Homework with AI
Get the answers you need in no time with our AI-driven, step-by-step assistance
Get Started
Differential Equations and Linear Algebra
Authors: Jerry Farlow, James E. Hall, Jean Marie McDill, Beverly H. West
2nd edition
131860615, 978-0131860612