

Answered step by step
Verified Expert Solution
Question
1 Approved Answer
Note from Kelly, Junior accountant. The sales and cost of goods sold information is correct so I slotted it in the owners confirmed that these
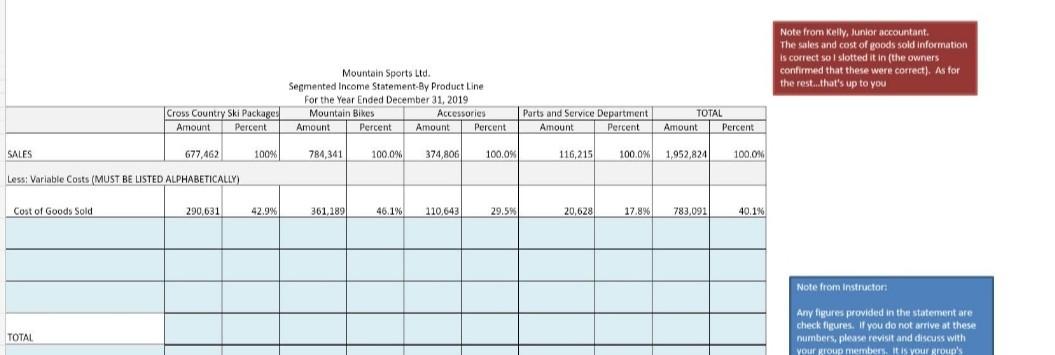
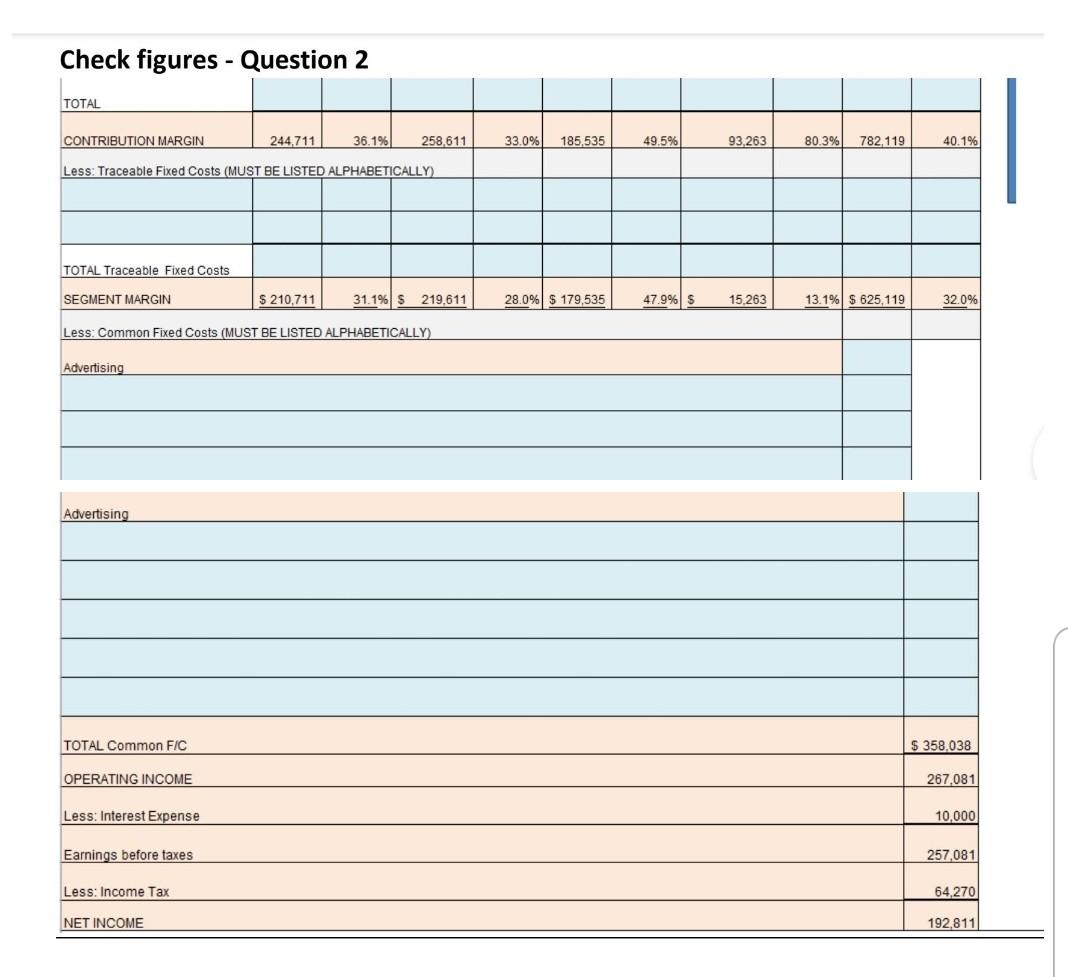
Note from Kelly, Junior accountant. The sales and cost of goods sold information is correct so I slotted it in the owners confirmed that these were correct). As for the rest..that's up to you Cross Country Ski Packages Amount Percent Mountain Sports Ltd Segmented Income Statement-By Product Line For the Year Ended December 31, 2019 Mountain Bikes Accessories Amount Percent Amount Percent 784,341 100.0% 374,806 100,0% Parts and Service Department Amount Percent TOTAL Amount Percent SALES 677,462 100% 116,215 100.0% 1.952,824 100,0% Less: Variable Costs (MUST BE LISTED ALPHABETICALLY) Cost of Goods Sold 290,631 42.9% 361,189 46.1% 110.643 29.5% 20,628 17.896 783,091 40.1% Note from Instructor TOTAL Any figures provided in the statement are check figures. If you do not arrive at these numbers, please revisit and discuss with your group members. It is your group's Check figures - Question 2 TOTAL CONTRIBUTION MARGIN 244,711 36.1% 258,611 33.0% 185,535 49.5% 93.263 80.3% 782,119 40.1% Less: Traceable Fixed Costs (MUST BE LISTED ALPHABETICALLY TOTAL Traceable Fixed Costs SEGMENT MARGIN $ 210,711 31.1% $ 219,611 28.0% $ 179,535 47.9% 5 15.263 13.1% $ 625,119 32.0% Less: Common Fixed Costs (MUST BE LISTED ALPHABETICALLY) Advertising Advertising TOTAL Common FIC $ 358,038 OPERATING INCOME 267,081 Less: Interest Expense 10,000 Earnings before taxes 257,081 Less: Income Tax 64,270 NET INCOME 192,811) Note from Kelly, Junior accountant. The sales and cost of goods sold information is correct so I slotted it in the owners confirmed that these were correct). As for the rest..that's up to you Cross Country Ski Packages Amount Percent Mountain Sports Ltd Segmented Income Statement-By Product Line For the Year Ended December 31, 2019 Mountain Bikes Accessories Amount Percent Amount Percent 784,341 100.0% 374,806 100,0% Parts and Service Department Amount Percent TOTAL Amount Percent SALES 677,462 100% 116,215 100.0% 1.952,824 100,0% Less: Variable Costs (MUST BE LISTED ALPHABETICALLY) Cost of Goods Sold 290,631 42.9% 361,189 46.1% 110.643 29.5% 20,628 17.896 783,091 40.1% Note from Instructor TOTAL Any figures provided in the statement are check figures. If you do not arrive at these numbers, please revisit and discuss with your group members. It is your group's Check figures - Question 2 TOTAL CONTRIBUTION MARGIN 244,711 36.1% 258,611 33.0% 185,535 49.5% 93.263 80.3% 782,119 40.1% Less: Traceable Fixed Costs (MUST BE LISTED ALPHABETICALLY TOTAL Traceable Fixed Costs SEGMENT MARGIN $ 210,711 31.1% $ 219,611 28.0% $ 179,535 47.9% 5 15.263 13.1% $ 625,119 32.0% Less: Common Fixed Costs (MUST BE LISTED ALPHABETICALLY) Advertising Advertising TOTAL Common FIC $ 358,038 OPERATING INCOME 267,081 Less: Interest Expense 10,000 Earnings before taxes 257,081 Less: Income Tax 64,270 NET INCOME 192,811)
Step by Step Solution
There are 3 Steps involved in it
Step: 1

Get Instant Access to Expert-Tailored Solutions
See step-by-step solutions with expert insights and AI powered tools for academic success
Step: 2

Step: 3
Ace Your Homework with AI
Get the answers you need in no time with our AI-driven, step-by-step assistance
Get Started
Audit Studies Behind The Scenes With Theory Method And Nuance
Authors: S. Michael Gaddis
1st Edition
3030100200, 978-3030100209