

Answered step by step
Verified Expert Solution
Question
1 Approved Answer
Note: I want the answers step by step The following Table includes information on the quantity supplied of a certain commodity and its price (X)
Note: I want the answers step by step
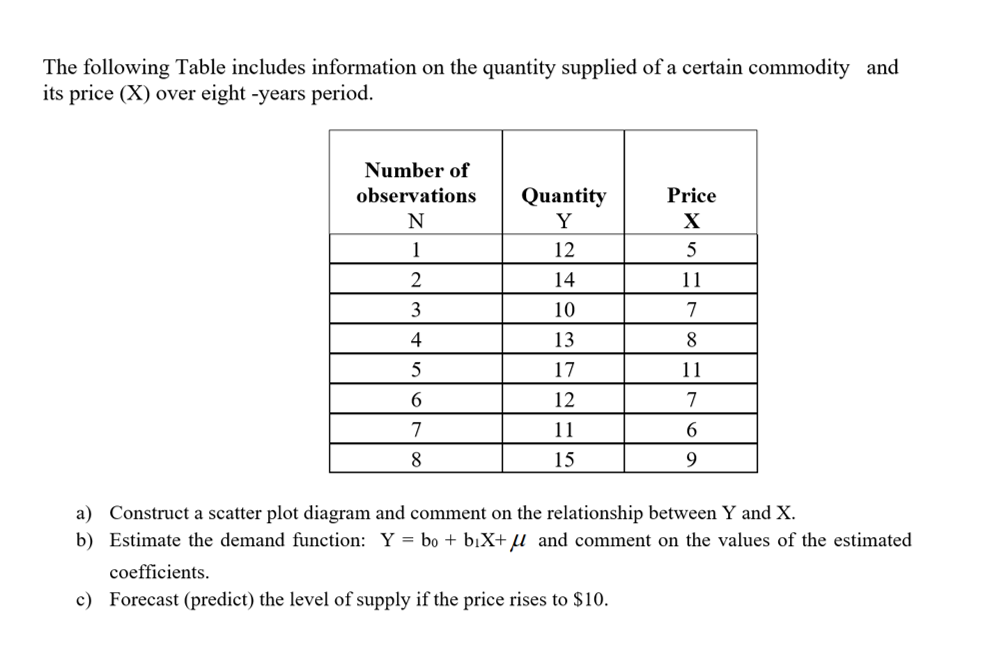
The following Table includes information on the quantity supplied of a certain commodity and its price (X) over eight-years period. Number of observations N 1 Price X 5 2 11 7 3 Quantity Y 12 14 10 13 17 12 11 15 4 8 5 6 11 7 6 7 8 9 a) Construct a scatter plot diagram and comment on the relationship between Y and X. b) Estimate the demand function: Y = bo + bX+u and comment on the values of the estimated coefficients. c) Forecast (predict) the level of supply if the price rises to $10Step by Step Solution
There are 3 Steps involved in it
Step: 1

Get Instant Access to Expert-Tailored Solutions
See step-by-step solutions with expert insights and AI powered tools for academic success
Step: 2

Step: 3
Ace Your Homework with AI
Get the answers you need in no time with our AI-driven, step-by-step assistance
Get Started
Managerial Accounting
Authors: Ray Garrison, Eric Noreen and Peter Brewer
14th edition
978-007811100, 78111005, 978-0078111006