 NOTE!: If you could please post the steps to for each formula using goal seek, finding target profit, break-even volume etc. that would be great! Thank You!
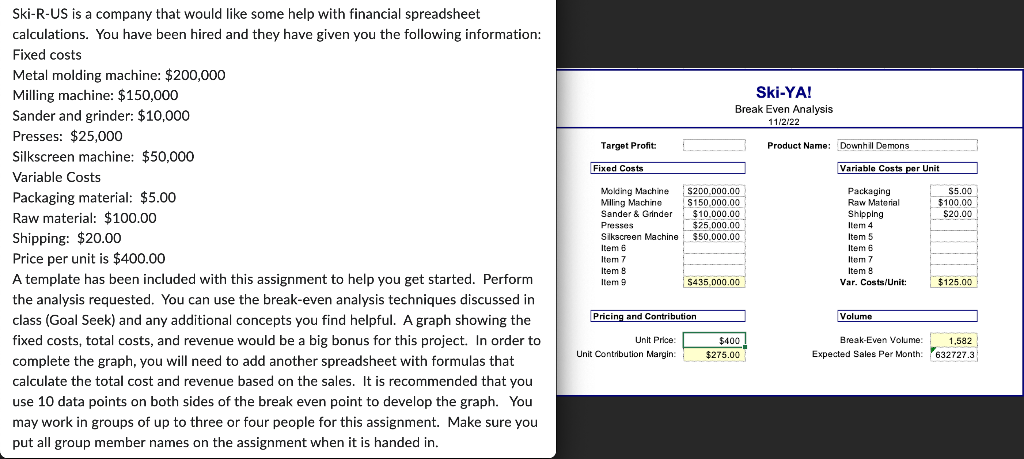
Ski-R-US is a company that would like some help with financial spreadsheet calculations. You have been hired and they have given you the following information: Fixed costs Metal molding machine: $200,000 Milling machine: $150,000 Sander and grinder: $10,000 Presses: $25,000 Silkscreen machine: $50,000 Variable Costs Packaging material: $5.00 Raw material: $100.00 Shipping: $20.00 Price per unit is $400.00 A template has been included with this assignment to help you get started. Perform the analysis requested. You can use the break-even analysis techniques discussed in class (Goal Seek) and any additional concepts you find helpful. A graph showing the fixed costs, total costs, and revenue would be a big bonus for this project. In order to complete the graph, you will need to add another spreadsheet with formulas that calculate the total cost and revenue based on the sales. It is recommended that you use 10 data points on both sides of the break even point to develop the graph. You may work in groups of up to three or four people for this assignment. Make sure you put all group member names on the assignment when it is handed in. Ski-R-US is a company that would like some help with financial spreadsheet calculations. You have been hired and they have given you the following information: Fixed costs Metal molding machine: $200,000 Milling machine: $150,000 Sander and grinder: $10,000 Presses: $25,000 Silkscreen machine: $50,000 Variable Costs Packaging material: $5.00 Raw material: $100.00 Shipping: $20.00 Price per unit is $400.00 A template has been included with this assignment to help you get started. Perform the analysis requested. You can use the break-even analysis techniques discussed in class (Goal Seek) and any additional concepts you find helpful. A graph showing the fixed costs, total costs, and revenue would be a big bonus for this project. In order to complete the graph, you will need to add another spreadsheet with formulas that calculate the total cost and revenue based on the sales. It is recommended that you use 10 data points on both sides of the break even point to develop the graph. You may work in groups of up to three or four people for this assignment. Make sure you put all group member names on the assignment when it is handed in