Answered step by step
Verified Expert Solution
Question
1 Approved Answer
NOTE:- Must answer Part 1 (comparative analysis ) and Part 2 (common-size analysis) , It is important very much: I appreciate and upvote guys who


NOTE:- Must answer Part 1 (comparative analysis) and Part 2 (common-size analysis), It is important very much: I appreciate and upvote guys who fulfil and follows the requirements.
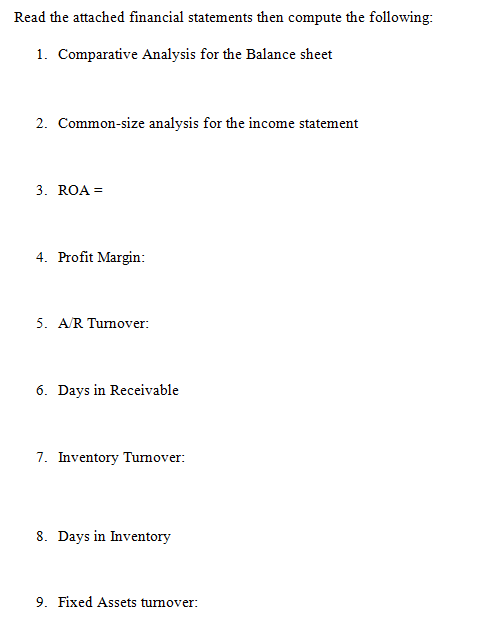
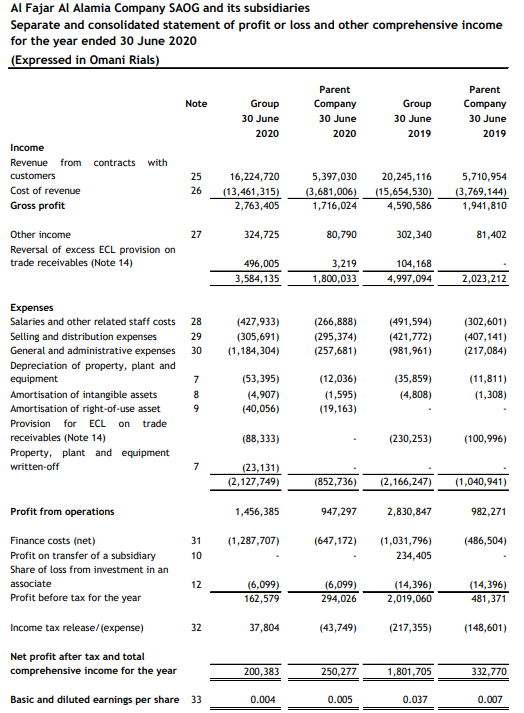
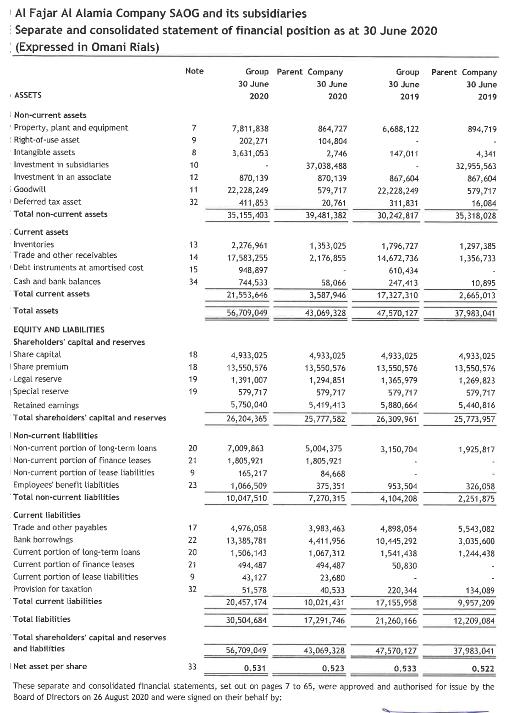
Read the attached financial statements then compute the following: 1. Comparative Analysis for the Balance sheet 2. Common-size analysis for the income statement 3. ROA = 4. Profit Margin: 5. AR Tumover: 6. Days in Receivable 7. Inventory Turnover: 8. Days in Inventory 9. Fixed Assets tumover: Al Fajar Al Alamia Company SAOG and its subsidiaries Separate and consolidated statement of profit or loss and other comprehensive income for the year ended 30 June 2020 (Expressed in Omani Rials) Note Group 30 June 2020 Parent Company 30 June 2020 Group 30 June 2019 Parent Company 30 June 2019 contracts with Income Revenue from customers Cost of revenue Gross profit 25 26 16,224,720 (13,461,315) 2,763,405 5,397,030 (3,681,006) 1,716,024 20,245, 116 (15,654,530) 4,590,586 5,710,954 (3,769,144) 1,941,810 27 324,725 80,790 302,340 81,402 Other income Reversal of excess ECL provision on trade receivables (Note 14) 496,005 3,584,135 3,219 1,800,033 104,168 4,997,094 2,023,212 28 29 30 (427,933) (305,691) (1,184,304) (266,888) (295,374) (257,681) (491,594) (421,772) (981,961) (302,601) (407,141) (217,084) Expenses Salaries and other related staff costs Selling and distribution expenses General and administrative expenses Depreciation of property, plant and equipment Amortisation of intangible assets Amortisation of right-of-use asset Provision for ECL on trade receivables (Note 14) Property, plant and equipment written-off 7 8 9 (53,395) (4,907) (40,056) (12,036) (1,595) (19,163) (35,859) (4,808) (11,811) (1,308) (88,333) (230,253) (100,996) 7 (23,131) (2,127,749) (852,736) (2,166,247) (1,040,941) 1,456,385 947,297 2,830,847 982,271 (1,287,707) 31 10 (647,172) (486,504) Profit from operations Finance costs (net) Profit on transfer of a subsidiary Share of loss from investment in an associate Profit before tax for the year (1,031,796) 234,405 12 (6,099) 162,579 (6,099) 294,026 (14,396) 2,019,060 (14,396) 481,371 Income tax release/(expense) 32 37,804 (43,749) (217,355) (148,601) Net profit after tax and total comprehensive income for the year 200,383 250,277 1,801,705 332,770 Basic and diluted earnings per share 33 0.004 0.005 0.037 0.007 Al Fajar Al Alamia Company SAOG and its subsidiaries Separate and consolidated statement of financial position as at 30 June 2020 (Expressed in Omani Rials) Note Group Parent Company 30 June 30 June 2020 2020 Group 30 June 2019 Parent Company 30 June 2019 ASSETS Non-current assets Property, plant and equipment 7 7,811,838 864,727 6,688,122 894,719 Right-of-use asset 202,271 104,804 Intangible assets 3.631,053 2,746 147,011 4,341 Investment in subsidiaries 10 37,038,488 32,955,583 Investment in an associate 12 870,139 870,139 867,604 867,604 Goodwill 11 22,228,249 579,717 22,228,249 579,717 Deferred tax asset 32 411,853 20,761 311,831 16.084 Total non-current assets 35,155,403 19,481,382 30,242,817 35,318,028 Current assets Inventories 13 2,276,961 1,353,025 1,796,727 1,297,385 Trade and other receivables 17,583,255 2,176,855 14,672,736 1,356,733 Debt instruments at amortised cost 15 948,897 610,434 Cash and bank balances 34 744,533 58,066 247,413 10,895 Total current assets 21,553,646 3,587,946 17,327,310 2,665,013 Total assets 56,709,049 43,069,328 47,570,127 37,983,041 EQUITY AND LIABILITIES Shareholders' capital and reserves Share capital 18 4,913,025 4,933,025 4,933,025 4,933,025 Share premium 18 13,550,576 13,550,576 13,550,576 13,550,576 Legal reserve 19 1,391,607 1,294,851 1,365,979 1,269,823 Special reserve 19 579,717 579,717 579,712 579,717 Retained earnings 5,750,040 5,419,413 5,880,664 5,440,816 Total shareholders' capital and reserves 26,204,365 25,777,582 26,309,961 25,773,957 I Non-current liabilities Non-current portion of long-term loans 20 7,009,863 5,004,375 3,150,704 1,925,817 Non-current portion of finance leases 21 1,805,921 1,805,921 Non-current portion of lease liabilities 9 165,217 84,668 Employees benefit liabilities 23 1,066,509 375,351 953,504 326,058 Total non-current liabilities 10,047,510 7,270,315 4,104,208 2,251,875 Current liabilities Trade and other payables 17 4,976,058 3,983,463 4,898,054 5,543,082 Bank borrowings 22 13,385,781 4,411,956 10,445,292 3,035,600 Current portion of long-term loans 20 1,506,113 1,067,312 1,541,438 1,244,438 Current portion of finance leases 21 494,487 494,487 50,830 Current portion of lease liabilities 9 43,127 23,680 Provision for taxation 32 51,578 40,533 220,344 134,089 Total current liabilities 20,457, 174 10,021,431 17,155,958 9,957,209 Total liabilities 30,504,684 17,291,746 21,260,166 12,209,084 Total shareholders' capital and reserves and Habilities 56,709,049 43,069,328 47,570,127 37,983,041 Net asset per share 33 0.531 0,523 0,533 0.522 These separate and consolidated financial statements, set out on pages 7 to 65, were approved and authorised for issue by the Board of Directors on 26 August 2020 and were signed on their behalf byStep by Step Solution
There are 3 Steps involved in it
Step: 1

Get Instant Access to Expert-Tailored Solutions
See step-by-step solutions with expert insights and AI powered tools for academic success
Step: 2

Step: 3

Ace Your Homework with AI
Get the answers you need in no time with our AI-driven, step-by-step assistance
Get Started


