Note: Please help me with this and also with the excel, step and step how to do it please, do the excel also. and choose
Note: Please help me with this and also with the excel, step and step how to do it please, do the excel also.
and choose any dataset.
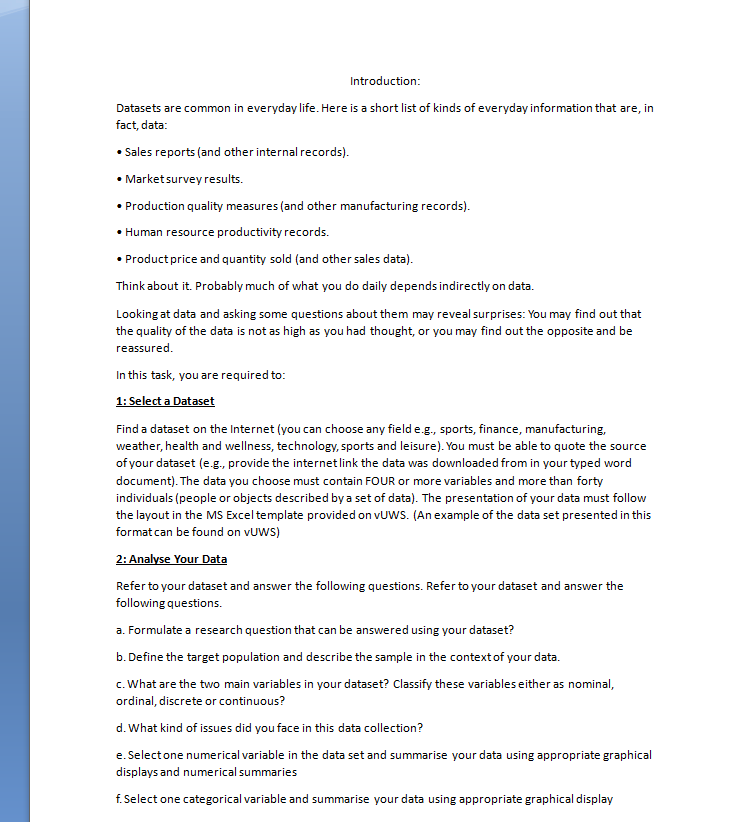
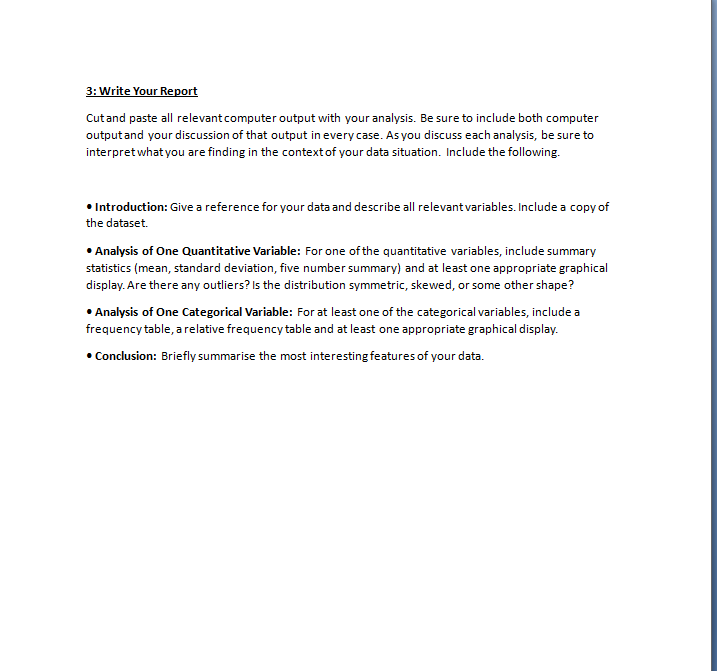
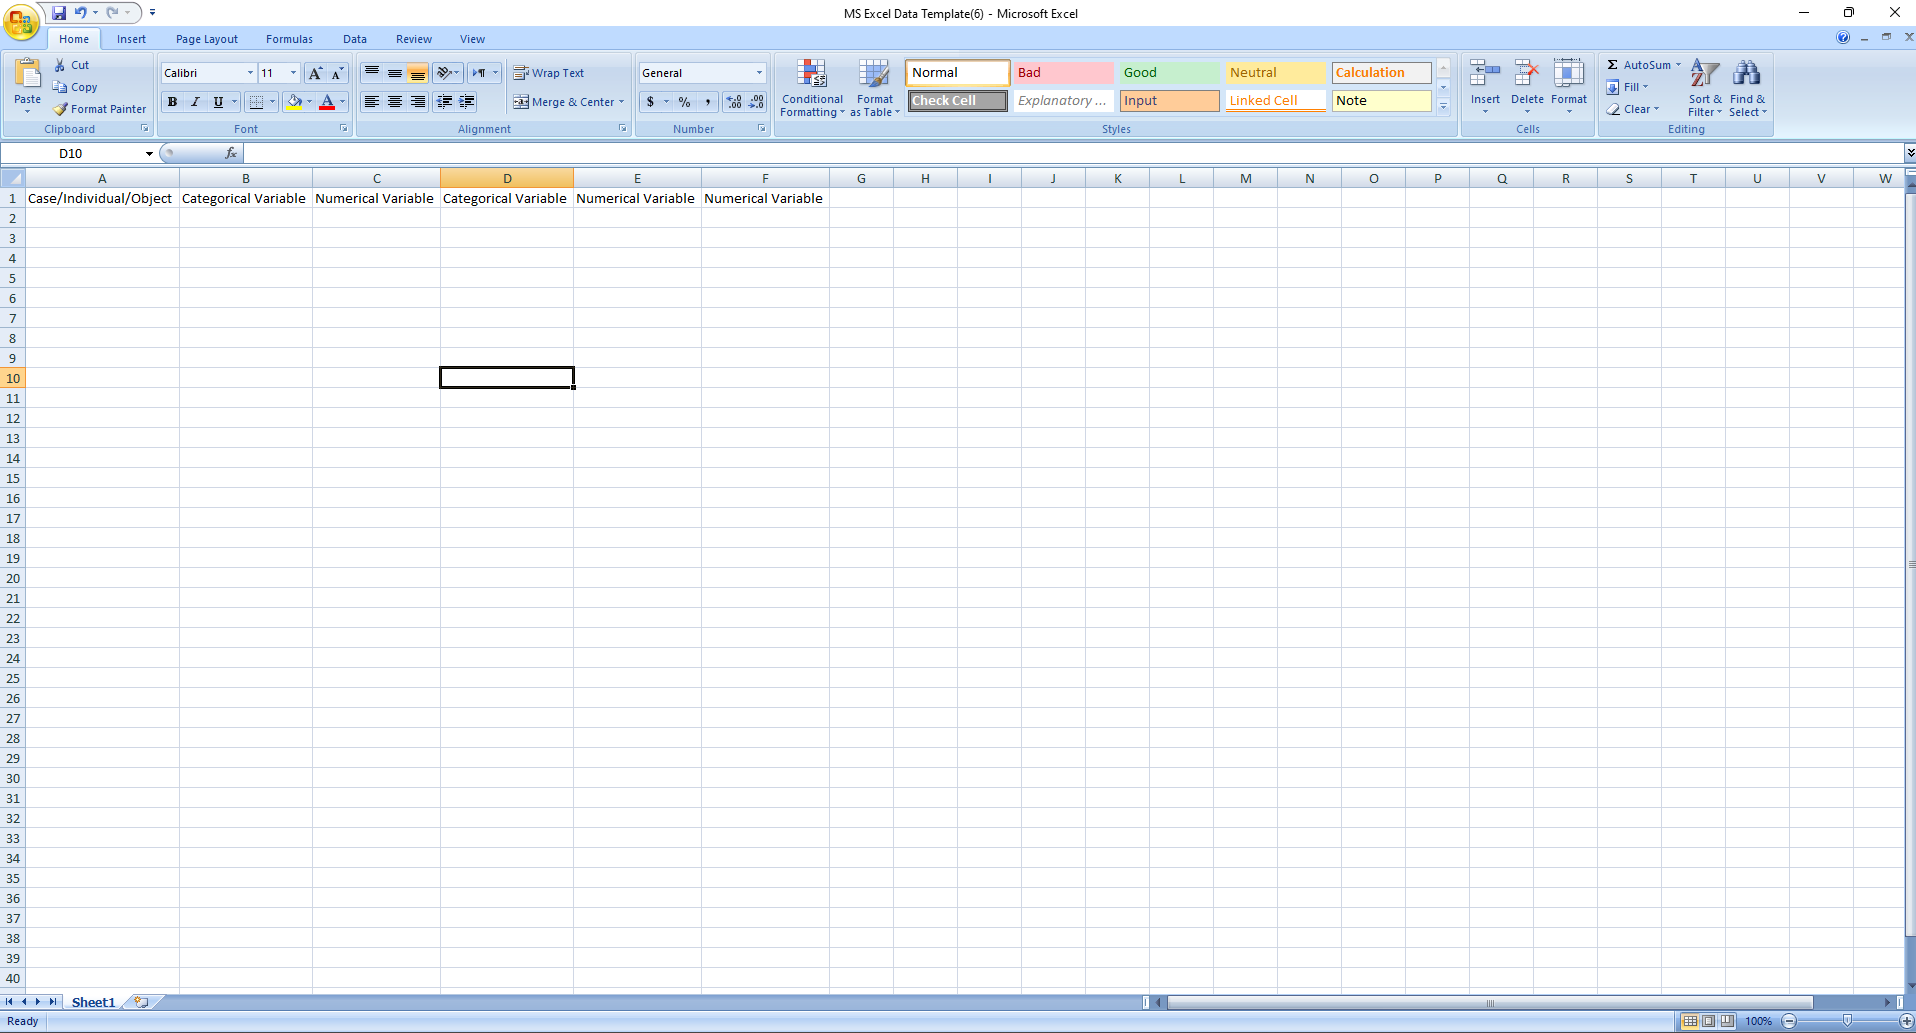
Introduction: Datasets are common in everyday life. Here is a short list of kinds of everyday information that are, in fact, data: . Sales reports (and other internal records). . Market survey results. . Production quality measures (and other manufacturing records). . Human resource productivity records. . Product price and quantity sold (and other sales data). Think about it. Probably much of what you do daily depends indirectly on data. Looking at data and asking some questions about them may reveal surprises: You may find out that the quality of the data is not as high as you had thought, or you may find out the opposite and be reassured. In this task, you are required to: 1: Select a Dataset Find a dataset on the Internet (you can choose any field e.g., sports, finance, manufacturing, weather, health and wellness, technology, sports and leisure). You must be able to quote the source of your dataset (e.g., provide the internet link the data was downloaded from in your typed word document). The data you choose must contain FOUR or more variables and more than forty individuals (people or objects described by a set of data). The presentation of your data must follow the layout in the MS Excel template provided on VUWS. (An example of the data set presented in this format can be found on vUWS) 2: Analyse Your Data Refer to your dataset and answer the following questions. Refer to your dataset and answer the following questions. a. Formulate a research question that can be answered using your dataset? b. Define the target population and describe the sample in the context of your data. c. What are the two main variables in your dataset? Classify these variables either as nominal, ordinal, discrete or continuous? d. What kind of issues did you face in this data collection? e. Select one numerical variable in the data set and summarise your data using appropriate graphical displays and numerical summaries f. Select one categorical variable and summarise your data using appropriate graphical display3: Write Your Report Cut and paste all relevant computer output with your analysis. Be sure to include both computer output and your discussion of that output in every case. As you discuss each analysis, be sure to interpret what you are finding in the context of your data situation. Include the following. " Introduction: Give a reference for your data and describe all relevant variables. Include a copy of the dataset. . Analysis of One Quantitative Variable: For one of the quantitative variables, include summary statistics (mean, standard deviation, five number summary) and at least one appropriate graphical display. Are there any outliers? Is the distribution symmetric, skewed, or some other shape? . Analysis of One Categorical Variable: For at least one of the categorical variables, include a frequency table, a relative frequency table and at least one appropriate graphical display. . Conclusion: Briefly summarise the most interesting features of your data.MS Excel Data Template(6) - Microsoft Excel X Home Data 7 - 0 Insert Page Layout Formulas Review View do Cut 11 - AA = = 2 1 - ' Wrap Text General Normal Bad Good Neutral Calculation E AutoSum Calibri Copy Fill Paste Merge & Center Conditional Format Check Cell Explanatory ... Input Linked Cell Note 41 Insert Delete Format Sort & Find & Format Painter Formatting * as Table 2 Clear Filter . Select Clipboard Font Alignment Number Styles Cells Editing D10 A B D E G H K L M N O P Q R S T U V W 1 Case/Individual/Object Categorical Variable Numerical Variable Categorical Variable Numerical Variable Numerical Variable A W N 10 11 36 37 38 39 40 14 4 Sheet1 3 Ready : 0 100%Instructions: All numerical calculations and graphs/plots should be done using EXCEL. Your assignment must be typed in a Word document in .doc or .docx format
Step by Step Solution
There are 3 Steps involved in it
Step: 1
Get Instant Access to Expert-Tailored Solutions
See step-by-step solutions with expert insights and AI powered tools for academic success
Step: 2
Step: 3
Ace Your Homework with AI
Get the answers you need in no time with our AI-driven, step-by-step assistance