

Answered step by step
Verified Expert Solution
Question
1 Approved Answer
Note: The overhead standards shown above do not include depreciation. When the finished goods are transferred to inventory, a factor for depreciation is added to
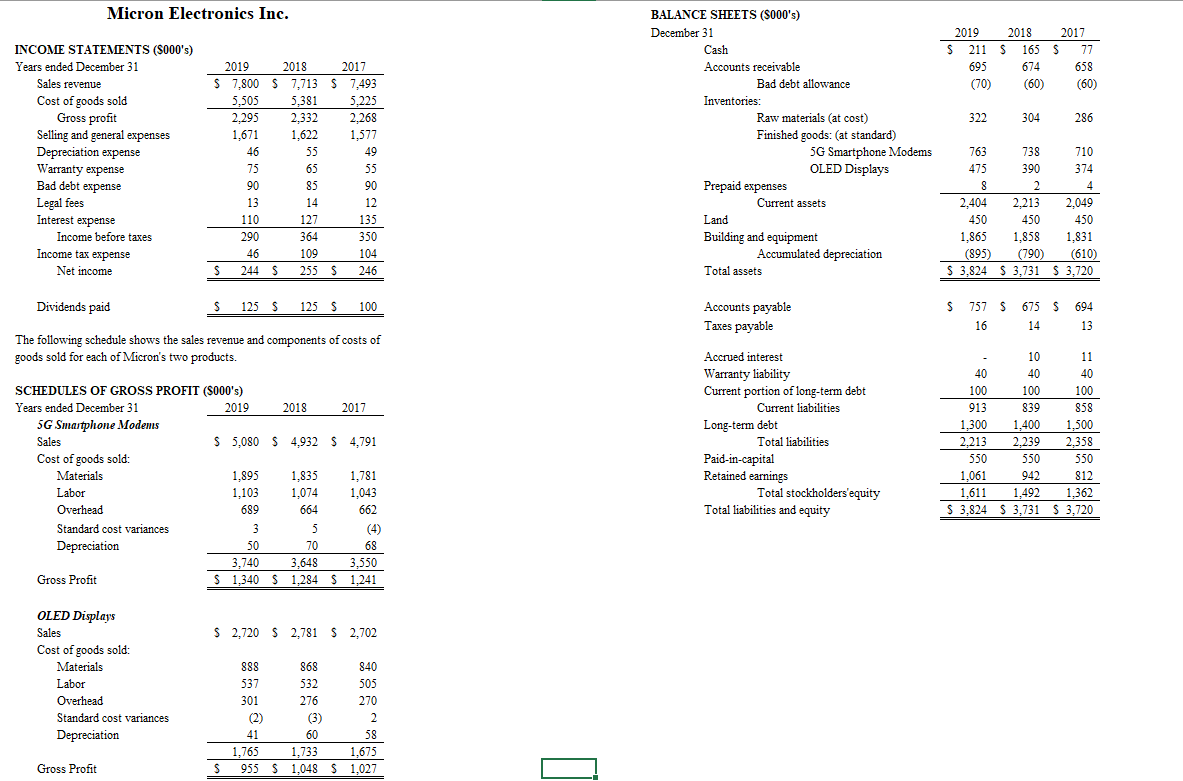
| Note: The overhead standards shown above do not include depreciation. When the finished goods are transferred to inventory, a factor for depreciation is added to the material-labor-overhead standard to determine the inventory carrying cost. |
| Additional Information: | |
| Micron Electronics primarily manufactures and sells two smartphone components: 5G modems and OLED displays. | |
| All sales are on credit to department stores and electronics wholesaling companies. Credit terms are net 30 days. | |
| Micron Electronics offers a one-year warranty covering manufacturing defects. | |
| Micron Electronics uses a periodic inventory system and determines its year-end inventory by taking a physical count on December 31. You and your supervisor observed the count on December 31, 2019 and performed numerous test counts, but you have not performed further audit tests regarding inventory. | |
| The interest rate on all debt is 8 percent. Annual interest and principal payments are due each December 1st. | |
| Required: | |
| The engagement partner has asked you to perform analytical procedures to identify potential risks and areas of audit focus in Micron Electronics 2019 financial statements. | |
| 1. Review the financial statements and identify accounts that appear to have unusual balances or appear to be anomalous and the reasons you identified them as such. | |
| a. A helpful hint is to examine income statement and balance sheet accounts that relate to each other. | |
| b. Horizontal analysis and ratio analysis will likely prove useful. | |
| 2. Try to use other information in the financial statements to determine the potential accounting issues or operating problems that might have caused the unexpected fluctuations you identify. | |
| 3. Identify areas of the companys operations that you believe should receive special attention during the 2019 audit. | |
Please be more specific As to what is missing. The question is complete to my knowledge.
Micron Electronics Inc. 2019 2018 2017 $ 211 S 165 S 77 695 674 658 (70) (60) (60) 322 304 286 INCOME STATEMENTS (5000's) Years ended December 31 Sales revenue Cost of goods sold Gross profit Selling and general expenses Depreciation expense Warranty expense Bad debt expense Legal fees Interest expense Income before taxes Income tax expense Net income 2019 2018 2017 $ 7,800 $ 7,713 $ 7,493 5,505 5,381 5.225 2.295 2.332 2.268 1,671 1,622 1,577 46 55 49 75 65 55 90 85 90 13 14 12 110 127 135 290 364 350 46 109 104 S 244 S 255 S 246 BALANCE SHEETS (S000's) December 31 Cash Accounts receivable Bad debt allowance Inventories: Raw materials (at cost) Finished goods: (at standard) 5G Smartphone Modems OLED Displays Prepaid expenses Current assets Land Building and equipment Accumulated depreciation Total assets 763 738 710 475 390 374 8 2 4 2,404 2.213 2,049 450 450 450 1,865 1,858 1,831 (895) (790) (610) $ 3,824 S 3,731 $ 3.720 Dividends paid S 125$ 125 S 100 675 $ 694 Accounts payable Taxes payable $ 757 S 16 14 13 The following schedule shows the sales revenue and components of costs of goods sold for each of Micron's two products. . SCHEDULES OF GROSS PROFIT (S000's) Years ended December 31 2019 2018 2017 SG Smartphone Modems Sales $ 5,080 $ 4,932 $ 4,791 Cost of goods sold: Materials 1,895 1,835 1,781 1,103 1,074 1,043 Overhead 689 664 662 Standard cost variances 3 5 (4) Depreciation 50 70 68 3,740 3,648 3.550 Gross Profit 1,340 $ 1,284 S 1,241 Accrued interest Warranty liability Current portion of long-term debt Current liabilities Long-term debt Total liabilities Paid-in-capital Retained earnings Total stockholders'equity Total liabilities and equity 10 11 40 40 40 100 100 100 913 839 858 1,300 1,400 1,500 2.213 2.239 2,358 550 550 550 1,061 942 812 1,611 1,492 $ 3,824 S 3,731 $ 3,720 Labor 1,362 $ 2,720 S 2,781 $ 2,702 OLED Displays Sales Cost of goods sold: Materials Labor Overhead Standard cost variances Depreciation 888 868 840 537 532 505 301 276 270 (2) (3) 2 41 60 58 1,765 1,733 1,675 955 $ 1,048 $ 1,027 Gross Profit O S Micron Electronics Inc. 2019 2018 2017 $ 211 S 165 S 77 695 674 658 (70) (60) (60) 322 304 286 INCOME STATEMENTS (5000's) Years ended December 31 Sales revenue Cost of goods sold Gross profit Selling and general expenses Depreciation expense Warranty expense Bad debt expense Legal fees Interest expense Income before taxes Income tax expense Net income 2019 2018 2017 $ 7,800 $ 7,713 $ 7,493 5,505 5,381 5.225 2.295 2.332 2.268 1,671 1,622 1,577 46 55 49 75 65 55 90 85 90 13 14 12 110 127 135 290 364 350 46 109 104 S 244 S 255 S 246 BALANCE SHEETS (S000's) December 31 Cash Accounts receivable Bad debt allowance Inventories: Raw materials (at cost) Finished goods: (at standard) 5G Smartphone Modems OLED Displays Prepaid expenses Current assets Land Building and equipment Accumulated depreciation Total assets 763 738 710 475 390 374 8 2 4 2,404 2.213 2,049 450 450 450 1,865 1,858 1,831 (895) (790) (610) $ 3,824 S 3,731 $ 3.720 Dividends paid S 125$ 125 S 100 675 $ 694 Accounts payable Taxes payable $ 757 S 16 14 13 The following schedule shows the sales revenue and components of costs of goods sold for each of Micron's two products. . SCHEDULES OF GROSS PROFIT (S000's) Years ended December 31 2019 2018 2017 SG Smartphone Modems Sales $ 5,080 $ 4,932 $ 4,791 Cost of goods sold: Materials 1,895 1,835 1,781 1,103 1,074 1,043 Overhead 689 664 662 Standard cost variances 3 5 (4) Depreciation 50 70 68 3,740 3,648 3.550 Gross Profit 1,340 $ 1,284 S 1,241 Accrued interest Warranty liability Current portion of long-term debt Current liabilities Long-term debt Total liabilities Paid-in-capital Retained earnings Total stockholders'equity Total liabilities and equity 10 11 40 40 40 100 100 100 913 839 858 1,300 1,400 1,500 2.213 2.239 2,358 550 550 550 1,061 942 812 1,611 1,492 $ 3,824 S 3,731 $ 3,720 Labor 1,362 $ 2,720 S 2,781 $ 2,702 OLED Displays Sales Cost of goods sold: Materials Labor Overhead Standard cost variances Depreciation 888 868 840 537 532 505 301 276 270 (2) (3) 2 41 60 58 1,765 1,733 1,675 955 $ 1,048 $ 1,027 Gross Profit O SStep by Step Solution
There are 3 Steps involved in it
Step: 1

Get Instant Access to Expert-Tailored Solutions
See step-by-step solutions with expert insights and AI powered tools for academic success
Step: 2

Step: 3
Ace Your Homework with AI
Get the answers you need in no time with our AI-driven, step-by-step assistance
Get Started
Cost Accounting A Managerial Emphasis
Authors: Charles T. Horngren, Srikant M.Dater, George Foster, Madhav
14th Edition
978-0132960649, 132960648, 132109174, 978-0132109178