Question
NOTE: THERE ARE INFORMATION NEEDED, REFER TO THE 2020 ANNUAL REPORT OF WALT DISNEY 1. WHAT IS THE DEFINITION OF LIABILITIES? A. EVEN THOUGH THEY
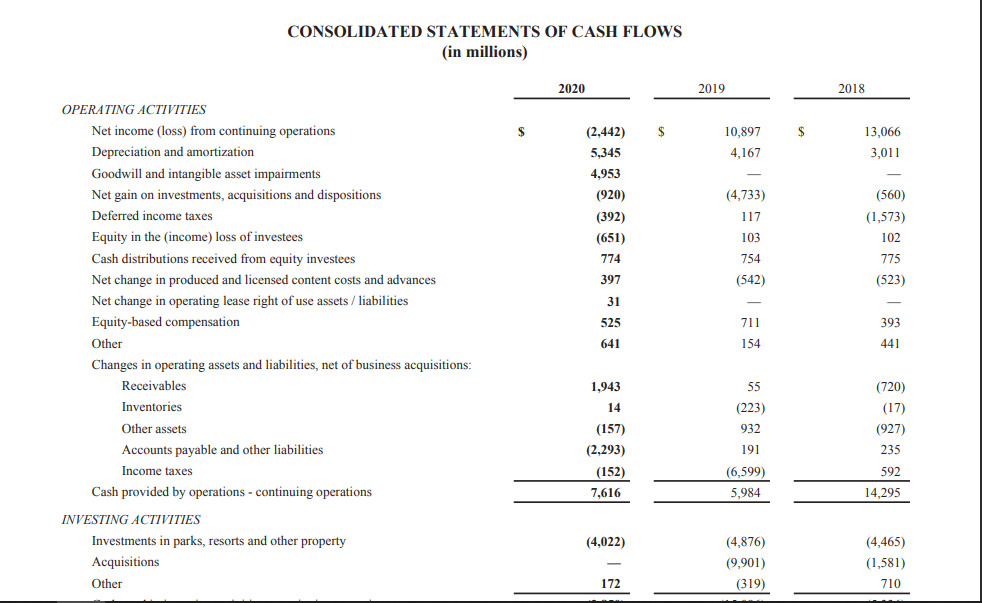
NOTE: THERE ARE INFORMATION NEEDED, REFER TO THE 2020 ANNUAL REPORT OF WALT DISNEY
1. WHAT IS THE DEFINITION OF LIABILITIES?
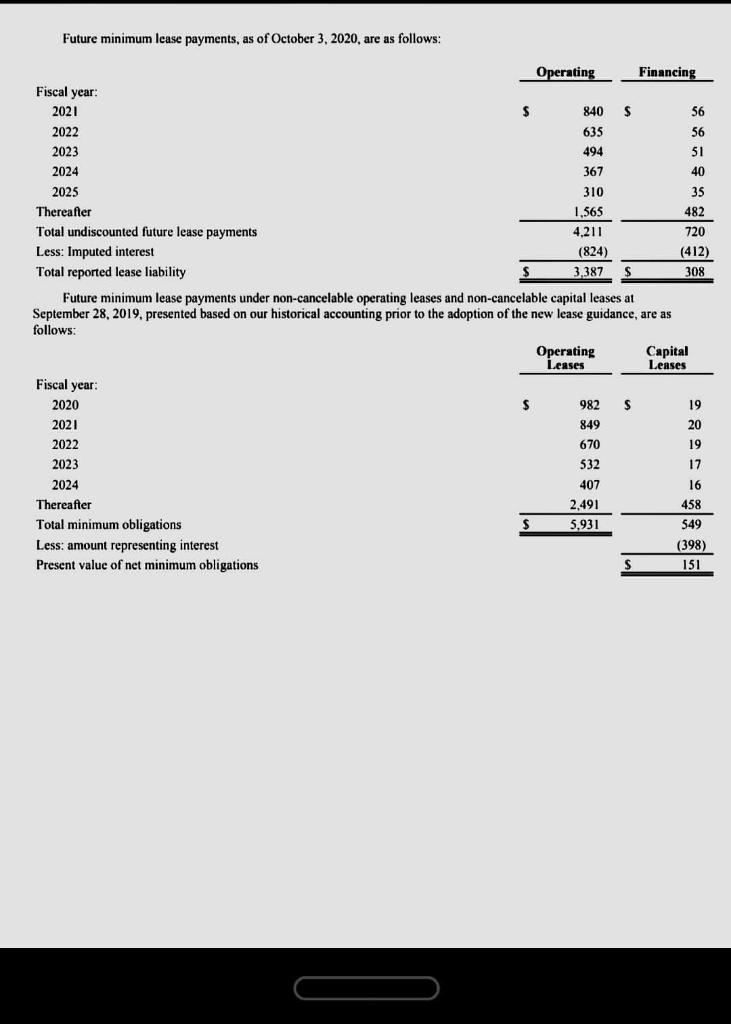
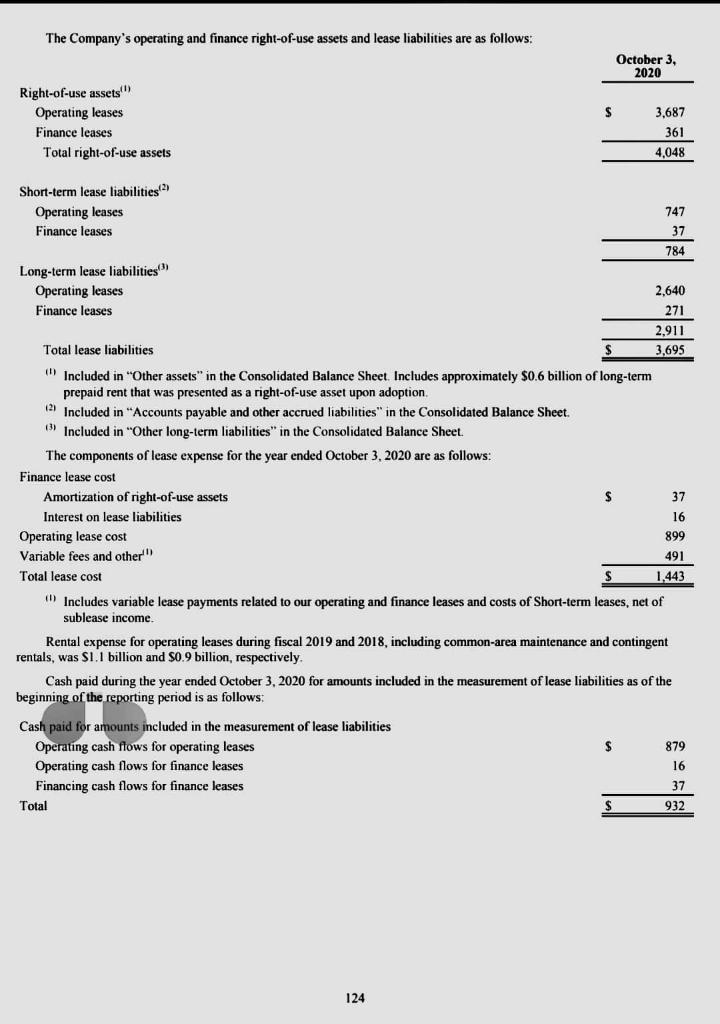
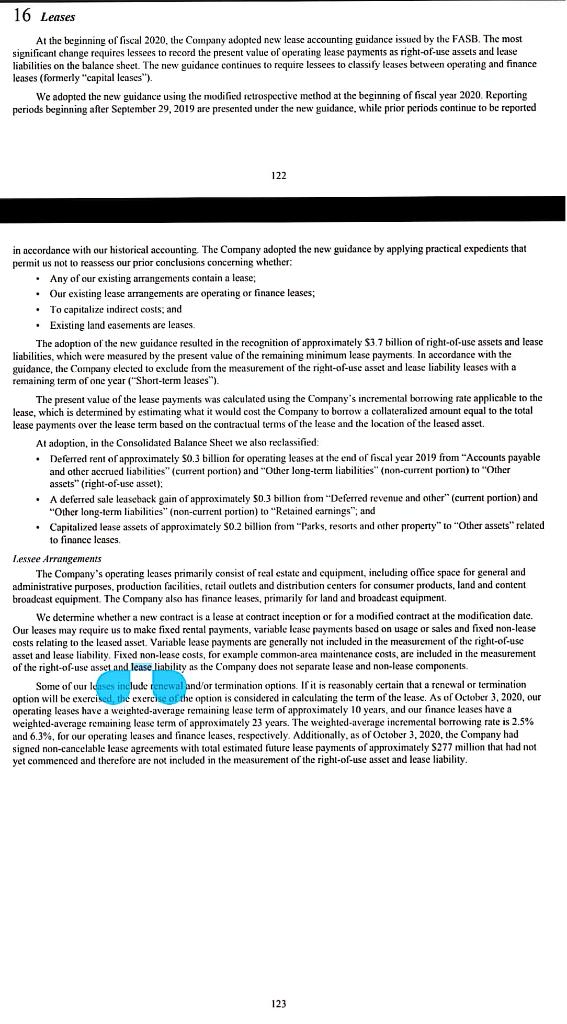
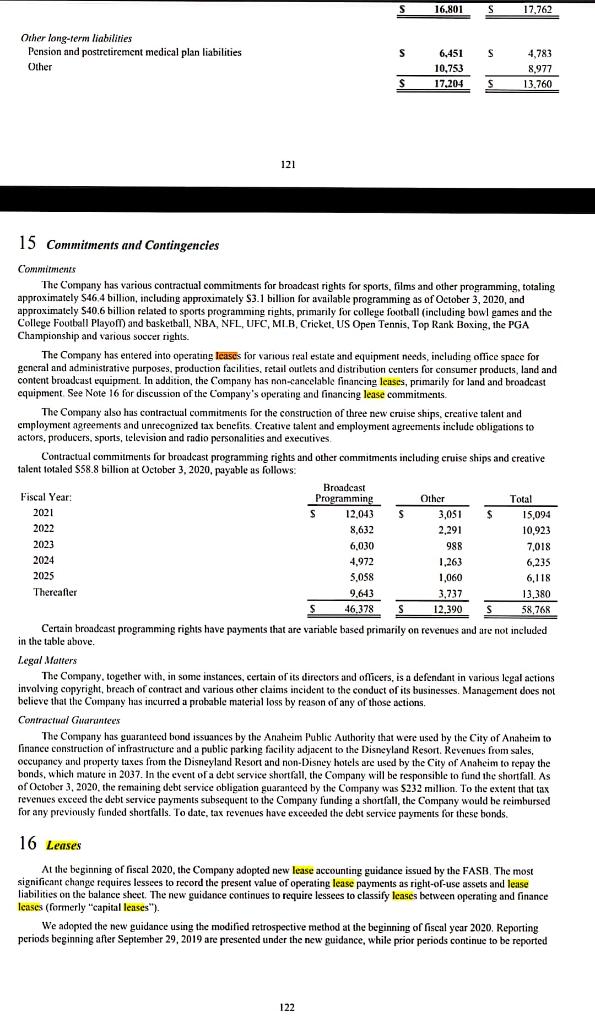
A. EVEN THOUGH THEY ARE NOT RECORDED AS LIABILITIES, DO THESE OPERATING LEASES SEEM TO MEET THE DEFINITION OF A LIABILITY?
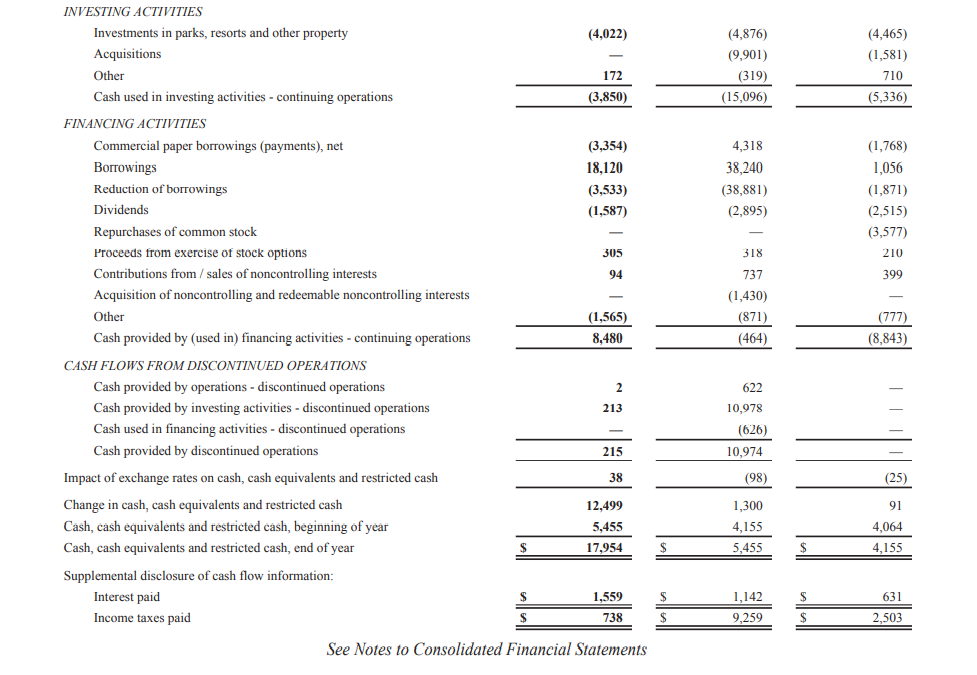
REFER TO THE FINANCING ACTIVITIES OF CASH FLOW
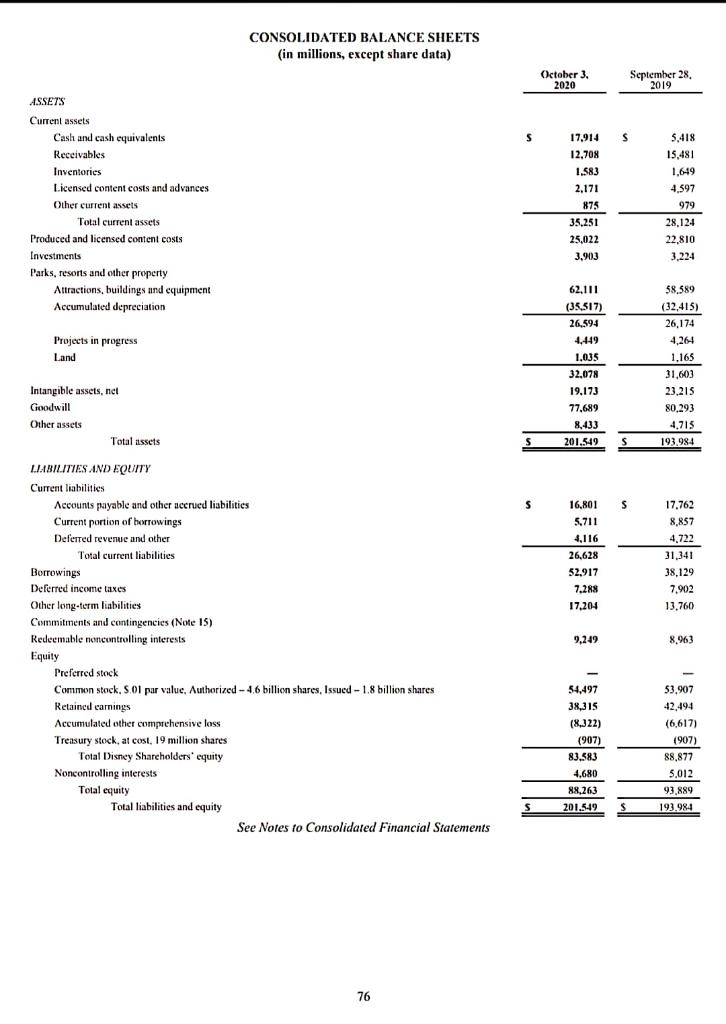
2. WHAT WAS THE AMOUNT OF NEW BORROWINGS DURING EACH 3 YEAR PERIOD? EXPLAIN WHERE DID THE NEW BORROWINGS COME FROM.
3. WHAT WAS THE AMOUNT OF DEBT REPAID DURING EACH YEAR? EXPLAIN.
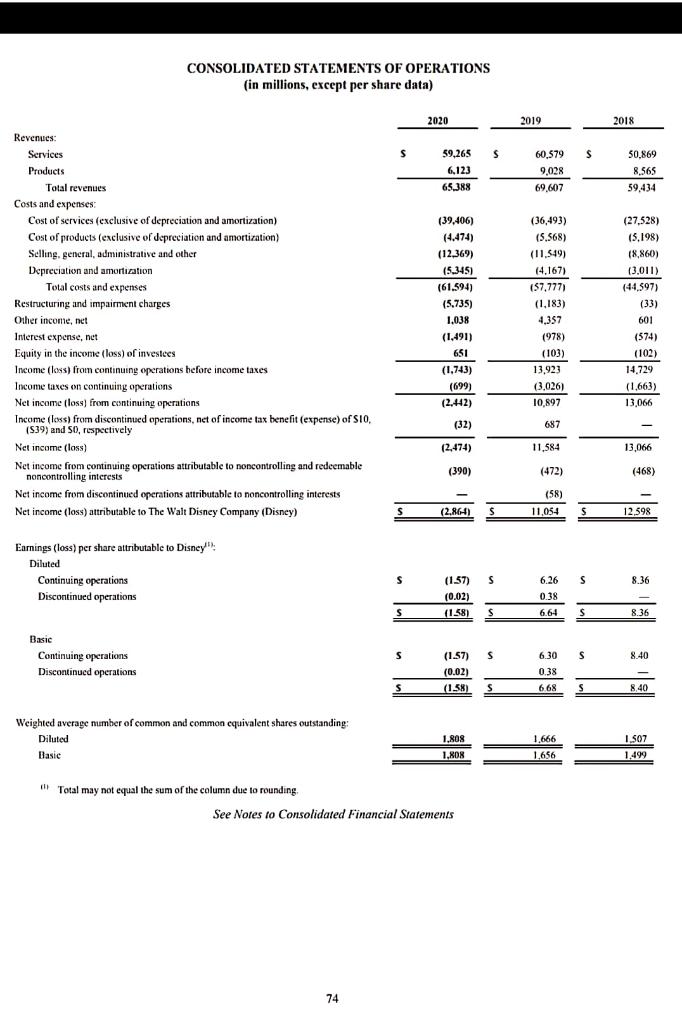
A. EVALUATE THE COMPANY'S DEBT-PAYING ABILITY.
PLEASE HELP ME TO ANSWER THESE QUESTIONS. THANK YOU.
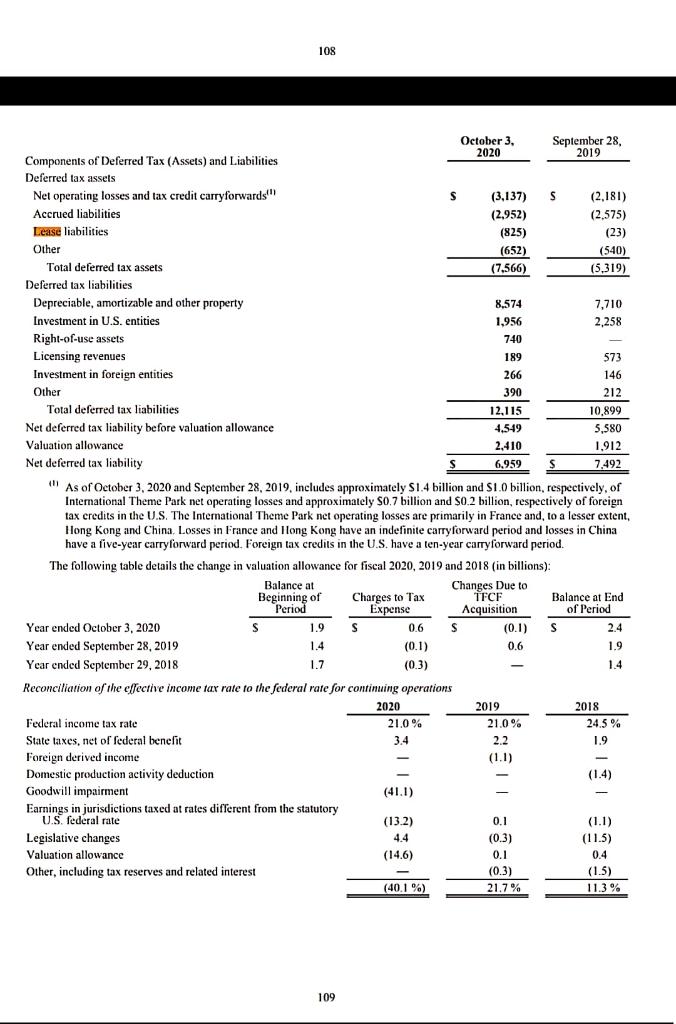
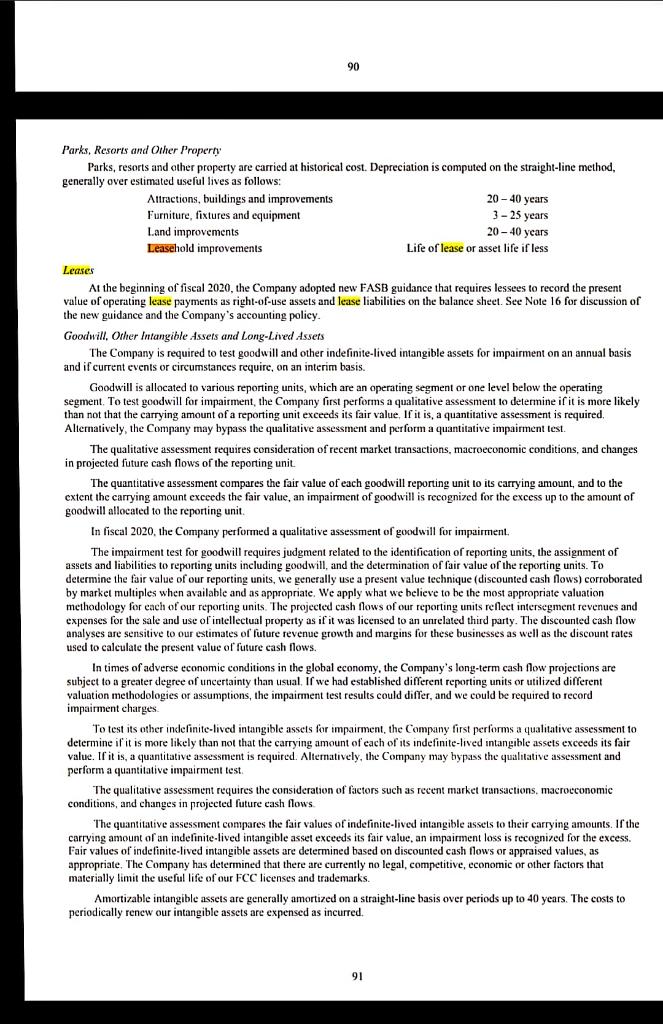
Future minimum lease payments, as of October 3, 2020, are as follows: Operating Financing Fiscal year: 2021 $ 840 $ 56 2022 635 56 2023 494 51 2024 367 40 2025 310 35 Thereafter 1,565 482 Total undiscounted future lease payments 4,211 720 Less: Imputed interest (824) (412) Total reported lease liability $ 3,387 $ 308 Future minimum lease payments under non-cancelable operating leases and non-cancelable capital leases at September 28, 2019, presented based on our historical accounting prior to the adoption of the new lease guidance, are as follows: Operating Capital Leases Leases Fiscal year: 2020 $ 982 $ 19 2021 849 20 2022 670 19 2023 532 17 2024 407 16 Thereafter 2.491 458 Total minimum obligations $ 5,931 549 Less: amount representing interest (398) Present value of net minimum obligations $ 151 The Company's operating and finance right-of-use assets and lease liabilities are as follows: October 3, 2020 Right-of-use assets Operating leases Finance leases Total right-of-use assets 3,687 361 4,048 Short-term lease liabilities Operating leases 747 Finance leases 37 784 Long-term lease liabilities Operating leases 2.640 Finance leases 271 2.911 Total lease liabilities 3,695 Included in "Other assets" in the Consolidated Balance Sheet. Includes approximately $0.6 billion of long-term prepaid rent that was presented as a right-of-use asset upon adoption (2) Included in "Accounts payable and other accrued liabilities" in the Consolidated Balance Sheet. 6) Included in "Other long-term liabilities" in the Consolidated Balance Sheet The components of lease expense for the year ended October 3, 2020 are as follows: Finance lease cost Amortization of right-of-use assets $ 37 Interest on lease liabilities 16 Operating lease cost 899 Variable fees and other 491 Total lease cost $ 1.443 Includes variable lease payments related to our operating and finance leases and costs of Short-term leases, net of sublease income. Rental expense for operating leases during fiscal 2019 and 2018, including common-area maintenance and contingent rentals, was S1.1 billion and S0.9 billion, respectively, Cash paid during the year ended October 3, 2020 for amounts included in the measurement of lease liabilities as of the beginning of the reporting period is as follows: $ Cash paid for amounts included in the measurement of lease liabilities Operating cash flows for operating leases Operating cash flows for finance leases Financing cash flows for finance leases Total : 879 16 37 932 124 16 Leases At the beginning of fiscal 2020, the Company adopted new lease accounting guidance issued by the FASB. The most significant change requires lessees to record the present value of operating lease payments as right-of-use assets and lease liabilities on the balance sheet. The new guidance continues to require lessees to classify leases between operating and finance leases (formerly capital leases"). We adopted the new guidance using the modified retrospective method at the beginning of fiscal year 2020 Reporting periods beginning after September 29, 2019 are presented under the new guidance, while prior periods continue to be reported 122 in accordance with our historical accounting The Company adopted the new guidance by applying practical expedients that permit us not to reassess our prior conclusions concerning whether: Any of our existing arrangements contain a lease; . Our existing lease arrangements are operating or finance leases; To capitalize indirect costs, and Existing land easements are leases. The adoption of the new guidance resulted in the recognition of approximately $3.7 billion of right-of-use assets and lease liabilities, which were measured by the present value of the remaining minimum lease payments. In accordance with the guidance, the Company elected to exclude from the measurement of the right-of-use asset and lease liability cases with a remaining term of one year ("Short-term leases). The present value of the lease payments was calculated using the Company's incremental borrowing rate applicable to the lease, which is determined by estimating what it would cost the Company to borrow a collateralized amount equal to the total lease payments over the lease term based on the contractual terms of the lease and the location of the leased asset. At adoption, in the Consolidated Balance Sheet we also reclassified: Deferred rent of approximately 50.3 billion for operating leases at the end of fiscal year 2019 from "Accounts payable and other accrued liabilities" (current portion) and "Other long-term liabilities" (non-current portion) to "Other assets" (right-of-use asset): . A deferred sale leaseback gain of approximately $0.3 billion from "Deferred revenue and other" (current portion) and "Other long-term liabilities" (non-current portion) to "Retained earnings", and Capitalized lease assets of approximately 0.2 billion from "Parks, resorts and other property" to "Other assets" related to finance leases Lessee Arrangenients The Company's operating lenses primarily consist of real estate and equipment, including office space for general and administrative purposes, production facilities, retail outlets and distribution centers for consumer products, land and content broadcast equipment. The Company also has finance leases, primarily for land and broadcast equipment, We determine whether a new contract is a lease at contract inception or for a modified contract at the modification date. Our leases may require us to make fixed rental payments, variable case payments based on usage or sales and fixed non-lease costs relating to the leased asset. Variable lease payments are generally not included in the measurement of the right-of-use asset and lease liability. Fixed non-lease costs, for example common-area maintenance costs, are included in the measurement of the right-of-use asset and lease liability as the Company does not separate lease and non-lease components. Some of our lises include renewal and'or termination options. If it is reasonably certain that a renewal or termination option will be exercised, the exercise of the option is considered in calculating the term of the lease. As of October 3, 2020, our operating leases have a weighted average remaining lease term of approximately 10 years, and our finance leases have a weighted average remaining lease term of approximately years. The weighted-average incremental borrowing rate is 2.5% and 6.3%, for our operating leases and finance leases, respectively. Additionally, as of October 3, 2020, the Company had signed non-cancelable lease agreements with total estimated future lease payments of approximately $277 million that had not yet commenced and therefore are not included in the measurement of the right-of-use asset and lease liability. 123 S 16.801 S 17,762 Other long-term liabilities Pension and postretirement medical plan liabilities Other S S 6,451 10.753 17,204 4.783 8,977 13.760 s 121 15 Commitments and Contingencies Commitments The Company has various contractual commitments for broadcast rights for sports, films and other programming, totaling approximately 546.4 billion, including approximately $3.1 billion for available programming as of October 3, 2020, and approximately 540.6 billion related to sports programming rights, primarily for college football (including bowl games and the College Football Playof) and basketball, NBA, NFL, UFC, MLB, Cricket, US Open Tennis, Top Rank Boxing, the PGA Championship and various soccer rights. The Company has entered into operating Icases for various real estate and equipment needs, including office space for general and administrative purposes, production facilities, retail outlets and distribution centers for consumer products, land and content broadcast equipment. In addition, the Company has non-cancelable financing leases, primarily for land and broadcast equipment See Note 16 for discussion of the Company's operating and financing lease commitments. The Company also has contractual commitments for the construction of three new cruise ships, creative talent and employment agreements and unrecognized tax benefits. Creative talent and employment agreements include obligations to actors, producers, sports, television and radio personalities and executives Contractual commitments for broadcast programming rights and other commitments including cruise ships and creative talent totaled $58.8 billion at October 3, 2020, payable as follows: Broadcast Fiscal Year Programming Other Total 2021 s 12,043 $ 3,051 $ 15,094 2022 8,632 2.291 10,923 2023 6,030 988 7,018 2024 4,972 1,263 6,235 2025 5,058 1,060 6,118 Thereafter 9.643 3.737 13.380 46,378 S 12.390 58,768 Certain broadcast programming rights have payments that are variable based primarily on revenues and are not included in the table above. Legal Matters The Company, together with, in some instances, certain of its directors and officers, is a defendant in various legal actions involving copyright, breach of contract and various other claims incident to the conduct of its businesses. Management does not believe that the Company has incurred a probable material loss by reason of any of those actions. Contractual Guarantees The Company has guaranteed bond issuances by the Anaheim Public Authority that were used by the City of Anaheim to finance construction of infrastructure and a public parking facility adjacent to the Disneyland Resort Revenues from sales, occupancy and property taxes from the Disneyland Resort and non-Disney hotels are used by the City of Anaheim to repay the bonds, which mature in 2037. In the event of a debt service shortfall, the Company will be responsible to fund the shortfall. As of October 3, 2020, the remaining debt service obligation guaranteed by the Company was $232 million. To the extent that tax revenues exceed the debt service payments subsequent to the Company funding a shortfall, the Company would be reimbursed for any previously funded shortfalls. To date, tax revenues have exceeded the debt service payments for these bonds. 16 Leases At the beginning of fiscal 2020, the Company adopted new lease accounting guidance issued by the FASB. The most significant change requires lessees to record the present value of operating lease payments as right-of-use assets and lease liabilities on the balance sheet. The new guidance continues to require lessees to classify leases between operating and finance Icases (formerly "capital leases"). We adopted the new guidance using the modified retrospective method at the beginning of fiscal year 2020. Reporting periods beginning after September 29, 2019 are presented under the new guidance, while prior periods continue to be reported 122 90 Parks, Resorts and Other Property Parks, resorts and other property are carried at historical cost. Depreciation is computed on the straight-line method, generally over estimated useful lives as follows: Attractions, buildings and improvements 20 - 40 years Furniture, fixtures and equipment 3 - 25 years Land improvements 20 - 40 years Leasehold improvements Life of lease or asset life if less Leases At the beginning of fiscal 2020, the Company adopted new FASB guidance that requires lessees to record the present value of operating lease payments as right-of-use assets and lease liabilities on the balance sheet. See Note 16 for discussion of the new guidance and the Company's accounting policy. Goodwill. Other Intangible Assets and Long-Lived Assets The Company is required to test goodwill and other indefinite-lived intangible assets for impairment on an annual basis and if current events or circumstances require, on an interim basis. Goodwill is allocated to various reporting units, which are an operating segment or one level below the operating segment. To test goodwill for impairment , the Company first performs a qualitative assessment to determine if it is more likely than not that the carrying amount of a reporting unit exceeds its fair value. If it is, a quantitative assessment is required. Alternatively, the Company may bypass the qualitative assessment and perform a quantitative impairment test. The qualitative assessment requires consideration of recent market transactions, macroeconomic conditions, and changes in projected future cash flows the reporting unit. The quantitative assessment compares the fair value of each goodwill reporting unit to its carrying amount, and to the extent the carrying amount exceeds the fair value, an impairment of goodwill is recognized for the excess up to the amount of goodwill allocated to the reporting unit In fiscal 2020, the Company performed a qualitative assessment of goodwill for impairment. The impairment test for goodwill requires judgment related to the identification of reporting units, the assignment of assets and liabilities to reporting units including goodwill, and the determination of fair value of the reporting units. To determine the fair value of our reporting units, we generally use a present value technique (discounted cash flows) corroborated by market multiples when available and as appropriate. We apply what we believe to be the most appropriate valuation methodology for each of our reporting units. The projected cash flows of our reporting units reflect intersegment revenues and expenses for the sale and use of intellectual property as if it was licensed to an unrelated third party. The discounted cash flow analyses are sensitive to our estimates of future revenue growth and margins for these businesses as well as the discount rates used to calculate the present value of future cash flows. In times of adverse economic conditions in the global economy, the Company's long-term cash flow projections are subject to a greater degree of uncertainty than usual. If we had established different reporting units or utilized different valuation methodologies or assumptions, the impairment test results could differ, and we could be required to record impairment charges. To test its other indefinite-lived intangible assets for impairment, the Company first performs a qualitative assessment to determine if it is more likely than not that the carrying amount of each of its indefinite-lived intangible assets exceeds its fair value. If it is, a quantitative assessment is required. Alternatively, the Company may bypass the qualitative assessment and perform a quantitative impairment test The qualitative assessment requires the consideration of factors such as recent market transactions, macroeconomic conditions, and changes in projected future cash flows. The quantitative assessment compares the fair values of indefinite-lived intangible assets to their carrying amounts. If the carrying amount of an indefinite-lived intangible asset exceeds its fair value, an impairment loss is recognized for the excess. Fair values of indefinite-lived intangible assets are determined based on discounted cash flows or appraised values, as appropriate. The Company has determined that there are currently no legal, competitive, economic or other factors that materially limit the useful life of our FCC licenses and trademarks. Amortizable intangible assets are generally amortized on a straight-line basis over periods up to 40 years. The costs to periodically renew our intangible assets are expensed as incurred. 91 CONSOLIDATED STATEMENTS OF OPERATIONS (in millions, except per share data) 2020 2019 2018 $ 59,265 6,123 65.388 60.579 9,028 50.869 8,565 59.434 69.607 Revenues: Services Products Total revenues Costs and expenses Cost of services (exclusive of depreciation and amortization) Cost of products (exclusive of depreciation and amortization) Selling, general, administrative and other Depreciation and amortization Total costs and expenses Restructuring and impairment charges Other income, net Interest expense, net Equity in the income (loss) of investees Income (loss) from continuing operations before income taxes Income taxes on continuing operations Net income (loss) from continuing operations Income loss) from discontinued operations, net of income tax benefit (expense) of SIO, (539) and So, respectively Net income (loss) Net income from continuing operations attributable to noncontrolling and redeemable noncontrolling interests Net income from discontinued operations attributable to noncontrolling interests Net income (loss) attributable to The Walt Disney Company (Disney) (39.406) (4.474) (12.369) (5.345) (61.594) (5.735) 1.038 (1,491) 651 (1.743) ( (699) (2.442) (36,493) (5.568) (11,549) (4.167) (37,777) (1.183) 4,357 (978) (103) ( (27,528) (5,198) 18,860) (3.011) (44,597) (33) 601 (574) (102) 14,729 (1.663) 13,066 13,923 (3,026) 10,897 (32) 687 (2.474) 11,584 13,066 (390) (472) (468) (58) 11,054 (2.864) 5 s 12,598 Earnings (loss) per share attributable to Disney, Diluted Continuing operations Discontinued operations s s s 8.36 (1.57) (0.02) 6.26 0.38 6.64 S (1.58) s $ 8.36 Basic Continuing operations Discontinued operations s s 6.30 S 8.40 (1.57) (0.02) (1.58) 0.38 6.68 S S s 8.40 Weighted average number of common and common equivalent shares outstanding: Diluted Basic 1.808 1.666 1.656 1.507 1.499 1.80 Total may not equal the sum of the column due to rounding See Notes to Consolidated Financial Statements 74 CONSOLIDATED BALANCE SHEETS (in millions, except share data) October 3. 2020 September 28. 2019 S $ ASSETS Current assets Cash and cash equivalents Receivables Inventories Licensed content costs and advances Other current assets Total current assets Produced and licensed content costs Investments Parks, resorts and other property Attractions, buildings and equipment Accumulated depreciation 17,914 12.708 1.583 2.171 875 35.251 25,022 3,903 5,418 15,481 1,649 4.597 979 28.124 22,810 3.224 62,111 (35.517) ) 26,594 Projects in progress Land 4,449 1,035 58,589 (32,415) () 26,174 4,264 1.165 31,603 23.215 80,293 4,715 193.984 32.078 19.173 Intangible assets, net Goodwill Other assets Total assets 77.689 8,433 201.549 s s s S 16,801 5.711 4,116 26,628 52,917 7.288 17.204 17.762 8,857 4.722 31,341 38,129 7.902 13,760 9,249 8,963 LIABILITIES AND EQUITY Current liabilities Accounts payable and other accrued liabilities Current portion of borrowings Deferred revenue and other Total current liabilities Borrowings Deferred income taxes Other long-term liabilities Commitments and contingencies (Note 15) Redeemable noncontrolling interests Equity Preferred stock Common stock, S.01 par value, Authorized - 4.6 billion shares, Issued - 1.8 billion shares Retained earnings Accumulated other comprehensive loss Treasury stock, at cost, 19 million shares Total Disney Shareholders' equity Noncontrolling interests Total equity Total liabilities and equity See Notes to Consolidated Financial Statements 54,497 38,315 (8.322) (907) 83.583 4.680 88,263 El be 53,907 42,494 (6,617) (907) 88.877 5,012 93,889 193.984 201.549 76 (4,022) (4,876) (9,901) (319) (15,096) (4,465) (1,581) 710 (5,336) 172 (3,850) (3,354) 18,120 (3,533) (1,587) 4,318 38,240 (38,881) (2,895) (1,768) 1,056 (1,871) (2,515) (3,577) 210 318 305 94 399 INVESTING ACTIVITIES Investments in parks, resorts and other property Acquisitions Other Cash used in investing activities - continuing operations FINANCING ACTIVITIES Commercial paper borrowings (payments), net Borrowings Reduction of borrowings Dividends Repurchases of common stock Proceeds from exercise of stock options Contributions from / sales of noncontrolling interests Acquisition of noncontrolling and redeemable noncontrolling interests Other Cash provided by (used in) financing activities - continuing operations CASH FLOWS FROM DISCONTINUED OPERATIONS Cash provided by operations - discontinued operations Cash provided by investing activities - discontinued operations Cash used in financing activities - discontinued operations Cash provided by discontinued operations Impact of exchange rates on cash, cash equivalents and restricted cash Change in cash, cash equivalents and restricted cash Cash, cash equivalents and restricted cash, beginning of year Cash, cash equivalents and restricted cash, end of year Supplemental disclosure of cash flow information: Interest paid Income taxes paid (1,565) 8,480 737 (1,430) (871) ( (464) (777) (8,843) 2 213 622 10,978 (626) 10,974 215 38 (98) (25) 12,499 5,455 17,954 1,300 4,155 5,455 91 4,064 4,155 S $ $ 1,559 $ $ 1,142 9,259 631 2,503 $ 738 $ $ See Notes to Consolidated Financial Statements CONSOLIDATED STATEMENTS OF CASH FLOWS (in millions) 2020 2019 2018 S $ 10,897 4,167 13,066 3,011 (2,442) 5,345 4,953 (920) (392) (651) 774 397 31 525 (4.733) 117 103 754 (542) (560) (1,573) 102 775 (523) 711 393 OPERATING ACTIVITIES Net income (loss) from continuing operations Depreciation and amortization Goodwill and intangible asset impairments Net gain on investments, acquisitions and dispositions Deferred income taxes Equity in the income) loss of investees Cash distributions received from equity investees Net change in produced and licensed content costs and advances Net change in operating lease right of use assets / liabilities Equity-based compensation Other Changes in operating assets and liabilities, net of business acquisitions: Receivables Inventories Other assets Accounts payable and other liabilities Income taxes Cash provided by operations - continuing operations INVESTING ACTIVITIES Investments in parks, resorts and other property Acquisitions Other 641 154 441 1,943 14 55 (223) 932 191 (157) (2,293) (152) 7,616 (720) (17) (927) 235 592 14,295 (6,599) 5,984 (4,022) (4,876) (9,901) (319) (4,465) (1,581) 710 172 Future minimum lease payments, as of October 3, 2020, are as follows: Operating Financing Fiscal year: 2021 $ 840 $ 56 2022 635 56 2023 494 51 2024 367 40 2025 310 35 Thereafter 1,565 482 Total undiscounted future lease payments 4,211 720 Less: Imputed interest (824) (412) Total reported lease liability $ 3,387 $ 308 Future minimum lease payments under non-cancelable operating leases and non-cancelable capital leases at September 28, 2019, presented based on our historical accounting prior to the adoption of the new lease guidance, are as follows: Operating Capital Leases Leases Fiscal year: 2020 $ 982 $ 19 2021 849 20 2022 670 19 2023 532 17 2024 407 16 Thereafter 2.491 458 Total minimum obligations $ 5,931 549 Less: amount representing interest (398) Present value of net minimum obligations $ 151 The Company's operating and finance right-of-use assets and lease liabilities are as follows: October 3, 2020 Right-of-use assets Operating leases Finance leases Total right-of-use assets 3,687 361 4,048 Short-term lease liabilities Operating leases 747 Finance leases 37 784 Long-term lease liabilities Operating leases 2.640 Finance leases 271 2.911 Total lease liabilities 3,695 Included in "Other assets" in the Consolidated Balance Sheet. Includes approximately $0.6 billion of long-term prepaid rent that was presented as a right-of-use asset upon adoption (2) Included in "Accounts payable and other accrued liabilities" in the Consolidated Balance Sheet. 6) Included in "Other long-term liabilities" in the Consolidated Balance Sheet The components of lease expense for the year ended October 3, 2020 are as follows: Finance lease cost Amortization of right-of-use assets $ 37 Interest on lease liabilities 16 Operating lease cost 899 Variable fees and other 491 Total lease cost $ 1.443 Includes variable lease payments related to our operating and finance leases and costs of Short-term leases, net of sublease income. Rental expense for operating leases during fiscal 2019 and 2018, including common-area maintenance and contingent rentals, was S1.1 billion and S0.9 billion, respectively, Cash paid during the year ended October 3, 2020 for amounts included in the measurement of lease liabilities as of the beginning of the reporting period is as follows: $ Cash paid for amounts included in the measurement of lease liabilities Operating cash flows for operating leases Operating cash flows for finance leases Financing cash flows for finance leases Total : 879 16 37 932 124 16 Leases At the beginning of fiscal 2020, the Company adopted new lease accounting guidance issued by the FASB. The most significant change requires lessees to record the present value of operating lease payments as right-of-use assets and lease liabilities on the balance sheet. The new guidance continues to require lessees to classify leases between operating and finance leases (formerly capital leases"). We adopted the new guidance using the modified retrospective method at the beginning of fiscal year 2020 Reporting periods beginning after September 29, 2019 are presented under the new guidance, while prior periods continue to be reported 122 in accordance with our historical accounting The Company adopted the new guidance by applying practical expedients that permit us not to reassess our prior conclusions concerning whether: Any of our existing arrangements contain a lease; . Our existing lease arrangements are operating or finance leases; To capitalize indirect costs, and Existing land easements are leases. The adoption of the new guidance resulted in the recognition of approximately $3.7 billion of right-of-use assets and lease liabilities, which were measured by the present value of the remaining minimum lease payments. In accordance with the guidance, the Company elected to exclude from the measurement of the right-of-use asset and lease liability cases with a remaining term of one year ("Short-term leases). The present value of the lease payments was calculated using the Company's incremental borrowing rate applicable to the lease, which is determined by estimating what it would cost the Company to borrow a collateralized amount equal to the total lease payments over the lease term based on the contractual terms of the lease and the location of the leased asset. At adoption, in the Consolidated Balance Sheet we also reclassified: Deferred rent of approximately 50.3 billion for operating leases at the end of fiscal year 2019 from "Accounts payable and other accrued liabilities" (current portion) and "Other long-term liabilities" (non-current portion) to "Other assets" (right-of-use asset): . A deferred sale leaseback gain of approximately $0.3 billion from "Deferred revenue and other" (current portion) and "Other long-term liabilities" (non-current portion) to "Retained earnings", and Capitalized lease assets of approximately 0.2 billion from "Parks, resorts and other property" to "Other assets" related to finance leases Lessee Arrangenients The Company's operating lenses primarily consist of real estate and equipment, including office space for general and administrative purposes, production facilities, retail outlets and distribution centers for consumer products, land and content broadcast equipment. The Company also has finance leases, primarily for land and broadcast equipment, We determine whether a new contract is a lease at contract inception or for a modified contract at the modification date. Our leases may require us to make fixed rental payments, variable case payments based on usage or sales and fixed non-lease costs relating to the leased asset. Variable lease payments are generally not included in the measurement of the right-of-use asset and lease liability. Fixed non-lease costs, for example common-area maintenance costs, are included in the measurement of the right-of-use asset and lease liability as the Company does not separate lease and non-lease components. Some of our lises include renewal and'or termination options. If it is reasonably certain that a renewal or termination option will be exercised, the exercise of the option is considered in calculating the term of the lease. As of October 3, 2020, our operating leases have a weighted average remaining lease term of approximately 10 years, and our finance leases have a weighted average remaining lease term of approximately years. The weighted-average incremental borrowing rate is 2.5% and 6.3%, for our operating leases and finance leases, respectively. Additionally, as of October 3, 2020, the Company had signed non-cancelable lease agreements with total estimated future lease payments of approximately $277 million that had not yet commenced and therefore are not included in the measurement of the right-of-use asset and lease liability. 123 S 16.801 S 17,762 Other long-term liabilities Pension and postretirement medical plan liabilities Other S S 6,451 10.753 17,204 4.783 8,977 13.760 s 121 15 Commitments and Contingencies Commitments The Company has various contractual commitments for broadcast rights for sports, films and other programming, totaling approximately 546.4 billion, including approximately $3.1 billion for available programming as of October 3, 2020, and approximately 540.6 billion related to sports programming rights, primarily for college football (including bowl games and the College Football Playof) and basketball, NBA, NFL, UFC, MLB, Cricket, US Open Tennis, Top Rank Boxing, the PGA Championship and various soccer rights. The Company has entered into operating Icases for various real estate and equipment needs, including office space for general and administrative purposes, production facilities, retail outlets and distribution centers for consumer products, land and content broadcast equipment. In addition, the Company has non-cancelable financing leases, primarily for land and broadcast equipment See Note 16 for discussion of the Company's operating and financing lease commitments. The Company also has contractual commitments for the construction of three new cruise ships, creative talent and employment agreements and unrecognized tax benefits. Creative talent and employment agreements include obligations to actors, producers, sports, television and radio personalities and executives Contractual commitments for broadcast programming rights and other commitments including cruise ships and creative talent totaled $58.8 billion at October 3, 2020, payable as follows: Broadcast Fiscal Year Programming Other Total 2021 s 12,043 $ 3,051 $ 15,094 2022 8,632 2.291 10,923 2023 6,030 988 7,018 2024 4,972 1,263 6,235 2025 5,058 1,060 6,118 Thereafter 9.643 3.737 13.380 46,378 S 12.390 58,768 Certain broadcast programming rights have payments that are variable based primarily on revenues and are not included in the table above. Legal Matters The Company, together with, in some instances, certain of its directors and officers, is a defendant in various legal actions involving copyright, breach of contract and various other claims incident to the conduct of its businesses. Management does not believe that the Company has incurred a probable material loss by reason of any of those actions. Contractual Guarantees The Company has guaranteed bond issuances by the Anaheim Public Authority that were used by the City of Anaheim to finance construction of infrastructure and a public parking facility adjacent to the Disneyland Resort Revenues from sales, occupancy and property taxes from the Disneyland Resort and non-Disney hotels are used by the City of Anaheim to repay the bonds, which mature in 2037. In the event of a debt service shortfall, the Company will be responsible to fund the shortfall. As of October 3, 2020, the remaining debt service obligation guaranteed by the Company was $232 million. To the extent that tax revenues exceed the debt service payments subsequent to the Company funding a shortfall, the Company would be reimbursed for any previously funded shortfalls. To date, tax revenues have exceeded the debt service payments for these bonds. 16 Leases At the beginning of fiscal 2020, the Company adopted new lease accounting guidance issued by the FASB. The most significant change requires lessees to record the present value of operating lease payments as right-of-use assets and lease liabilities on the balance sheet. The new guidance continues to require lessees to classify leases between operating and finance Icases (formerly "capital leases"). We adopted the new guidance using the modified retrospective method at the beginning of fiscal year 2020. Reporting periods beginning after September 29, 2019 are presented under the new guidance, while prior periods continue to be reported 122 90 Parks, Resorts and Other Property Parks, resorts and other property are carried at historical cost. Depreciation is computed on the straight-line method, generally over estimated useful lives as follows: Attractions, buildings and improvements 20 - 40 years Furniture, fixtures and equipment 3 - 25 years Land improvements 20 - 40 years Leasehold improvements Life of lease or asset life if less Leases At the beginning of fiscal 2020, the Company adopted new FASB guidance that requires lessees to record the present value of operating lease payments as right-of-use assets and lease liabilities on the balance sheet. See Note 16 for discussion of the new guidance and the Company's accounting policy. Goodwill. Other Intangible Assets and Long-Lived Assets The Company is required to test goodwill and other indefinite-lived intangible assets for impairment on an annual basis and if current events or circumstances require, on an interim basis. Goodwill is allocated to various reporting units, which are an operating segment or one level below the operating segment. To test goodwill for impairment , the Company first performs a qualitative assessment to determine if it is more likely than not that the carrying amount of a reporting unit exceeds its fair value. If it is, a quantitative assessment is required. Alternatively, the Company may bypass the qualitative assessment and perform a quantitative impairment test. The qualitative assessment requires consideration of recent market transactions, macroeconomic conditions, and changes in projected future cash flows the reporting unit. The quantitative assessment compares the fair value of each goodwill reporting unit to its carrying amount, and to the extent the carrying amount exceeds the fair value, an impairment of goodwill is recognized for the excess up to the amount of goodwill allocated to the reporting unit In fiscal 2020, the Company performed a qualitative assessment of goodwill for impairment. The impairment test for goodwill requires judgment related to the identification of reporting units, the assignment of assets and liabilities to reporting units including goodwill, and the determination of fair value of the reporting units. To determine the fair value of our reporting units, we generally use a present value technique (discounted cash flows) corroborated by market multiples when available and as appropriate. We apply what we believe to be the most appropriate valuation methodology for each of our reporting units. The projected cash flows of our reporting units reflect intersegment revenues and expenses for the sale and use of intellectual property as if it was licensed to an unrelated third party. The discounted cash flow analyses are sensitive to our estimates of future revenue growth and margins for these businesses as well as the discount rates used to calculate the present value of future cash flows. In times of adverse economic conditions in the global economy, the Company's long-term cash flow projections are subject to a greater degree of uncertainty than usual. If we had established different reporting units or utilized different valuation methodologies or assumptions, the impairment test results could differ, and we could be required to record impairment charges. To test its other indefinite-lived intangible assets for impairment, the Company first performs a qualitative assessment to determine if it is more likely than not that the carrying amount of each of its indefinite-lived intangible assets exceeds its fair value. If it is, a quantitative assessment is required. Alternatively, the Company may bypass the qualitative assessment and perform a quantitative impairment test The qualitative assessment requires the consideration of factors such as recent market transactions, macroeconomic conditions, and changes in projected future cash flows. The quantitative assessment compares the fair values of indefinite-lived intangible assets to their carrying amounts. If the carrying amount of an indefinite-lived intangible asset exceeds its fair value, an impairment loss is recognized for the excess. Fair values of indefinite-lived intangible assets are determined based on discounted cash flows or appraised values, as appropriate. The Company has determined that there are currently no legal, competitive, economic or other factors that materially limit the useful life of our FCC licenses and trademarks. Amortizable intangible assets are generally amortized on a straight-line basis over periods up to 40 years. The costs to periodically renew our intangible assets are expensed as incurred. 91 CONSOLIDATED STATEMENTS OF OPERATIONS (in millions, except per share data) 2020 2019 2018 $ 59,265 6,123 65.388 60.579 9,028 50.869 8,565 59.434 69.607 Revenues: Services Products Total revenues Costs and expenses Cost of services (exclusive of depreciation and amortization) Cost of products (exclusive of depreciation and amortization) Selling, general, administrative and other Depreciation and amortization Total costs and expenses Restructuring and impairment charges Other income, net Interest expense, net Equity in the income (loss) of investees Income (loss) from continuing operations before income taxes Income taxes on continuing operations Net income (loss) from continuing operations Income loss) from discontinued operations, net of income tax benefit (expense) of SIO, (539) and So, respectively Net income (loss) Net income from continuing operations attributable to noncontrolling and redeemable noncontrolling interests Net income from discontinued operations attributable to noncontrolling interests Net income (loss) attributable to The Walt Disney Company (Disney) (39.406) (4.474) (12.369) (5.345) (61.594) (5.735) 1.038 (1,491) 651 (1.743) ( (699) (2.442) (36,493) (5.568) (11,549) (4.167) (37,777) (1.183) 4,357 (978) (103) ( (27,528) (5,198) 18,860) (3.011) (44,597) (33) 601 (574) (102) 14,729 (1.663) 13,066 13,923 (3,026) 10,897 (32) 687 (2.474) 11,584 13,066 (390) (472) (468) (58) 11,054 (2.864) 5 s 12,598 Earnings (loss) per share attributable to Disney, Diluted Continuing operations Discontinued operations s s s 8.36 (1.57) (0.02) 6.26 0.38 6.64 S (1.58) s $ 8.36 Basic Continuing operations Discontinued operations s s 6.30 S 8.40 (1.57) (0.02) (1.58) 0.38 6.68 S S s 8.40 Weighted average number of common and common equivalent shares outstanding: Diluted Basic 1.808 1.666 1.656 1.507 1.499 1.80 Total may not equal the sum of the column due to rounding See Notes to Consolidated Financial Statements 74 CONSOLIDATED BALANCE SHEETS (in millions, except share data) October 3. 2020 September 28. 2019 S $ ASSETS Current assets Cash and cash equivalents Receivables Inventories Licensed content costs and advances Other current assets Total current assets Produced and licensed content costs Investments Parks, resorts and other property Attractions, buildings and equipment Accumulated depreciation 17,914 12.708 1.583 2.171 875 35.251 25,022 3,903 5,418 15,481 1,649 4.597 979 28.124 22,810 3.224 62,111 (35.517) ) 26,594 Projects in progress Land 4,449 1,035 58,589 (32,415) () 26,174 4,264 1.165 31,603 23.215 80,293 4,715 193.984 32.078 19.173 Intangible assets, net Goodwill Other assets Total assets 77.689 8,433 201.549 s s s S 16,801 5.711 4,116 26,628 52,917 7.288 17.204 17.762 8,857 4.722 31,341 38,129 7.902 13,760 9,249 8,963 LIABILITIES AND EQUITY Current liabilities Accounts payable and other accrued liabilities Current portion of borrowings Deferred revenue and other Total current liabilities Borrowings Deferred income taxes Other long-term liabilities Commitments and contingencies (Note 15) Redeemable noncontrolling interests Equity Preferred stock Common stock, S.01 par value, Authorized - 4.6 billion shares, Issued - 1.8 billion shares Retained earnings Accumulated other comprehensive loss Treasury stock, at cost, 19 million shares Total Disney Shareholders' equity Noncontrolling interests Total equity Total liabilities and equity See Notes to Consolidated Financial Statements 54,497 38,315 (8.322) (907) 83.583 4.680 88,263 El be 53,907 42,494 (6,617) (907) 88.877 5,012 93,889 193.984 201.549 76 (4,022) (4,876) (9,901) (319) (15,096) (4,465) (1,581) 710 (5,336) 172 (3,850) (3,354) 18,120 (3,533) (1,587) 4,318 38,240 (38,881) (2,895) (1,768) 1,056 (1,871) (2,515) (3,577) 210 318 305 94 399 INVESTING ACTIVITIES Investments in parks, resorts and other property Acquisitions Other Cash used in investing activities - continuing operations FINANCING ACTIVITIES Commercial paper borrowings (payments), net Borrowings Reduction of borrowings Dividends Repurchases of common stock Proceeds from exercise of stock options Contributions from / sales of noncontrolling interests Acquisition of noncontrolling and redeemable noncontrolling interests Other Cash provided by (used in) financing activities - continuing operations CASH FLOWS FROM DISCONTINUED OPERATIONS Cash provided by operations - discontinued operations Cash provided by investing activities - discontinued operations Cash used in financing activities - discontinued operations Cash provided by discontinued operations Impact of exchange rates on cash, cash equivalents and restricted cash Change in cash, cash equivalents and restricted cash Cash, cash equivalents and restricted cash, beginning of year Cash, cash equivalents and restricted cash, end of year Supplemental disclosure of cash flow information: Interest paid Income taxes paid (1,565) 8,480 737 (1,430) (871) ( (464) (777) (8,843) 2 213 622 10,978 (626) 10,974 215 38 (98) (25) 12,499 5,455 17,954 1,300 4,155 5,455 91 4,064 4,155 S $ $ 1,559 $ $ 1,142 9,259 631 2,503 $ 738 $ $ See Notes to Consolidated Financial Statements CONSOLIDATED STATEMENTS OF CASH FLOWS (in millions) 2020 2019 2018 S $ 10,897 4,167 13,066 3,011 (2,442) 5,345 4,953 (920) (392) (651) 774 397 31 525 (4.733) 117 103 754 (542) (560) (1,573) 102 775 (523) 711 393 OPERATING ACTIVITIES Net income (loss) from continuing operations Depreciation and amortization Goodwill and intangible asset impairments Net gain on investments, acquisitions and dispositions Deferred income taxes Equity in the income) loss of investees Cash distributions received from equity investees Net change in produced and licensed content costs and advances Net change in operating lease right of use assets / liabilities Equity-based compensation Other Changes in operating assets and liabilities, net of business acquisitions: Receivables Inventories Other assets Accounts payable and other liabilities Income taxes Cash provided by operations - continuing operations INVESTING ACTIVITIES Investments in parks, resorts and other property Acquisitions Other 641 154 441 1,943 14 55 (223) 932 191 (157) (2,293) (152) 7,616 (720) (17) (927) 235 592 14,295 (6,599) 5,984 (4,022) (4,876) (9,901) (319) (4,465) (1,581) 710 172Step by Step Solution
There are 3 Steps involved in it
Step: 1

Get Instant Access to Expert-Tailored Solutions
See step-by-step solutions with expert insights and AI powered tools for academic success
Step: 2

Step: 3

Ace Your Homework with AI
Get the answers you need in no time with our AI-driven, step-by-step assistance
Get Started


