Question
Note: This is a screenshot of the dataset. It is too large to be directly pasted here since there aren't enough characters. If there is
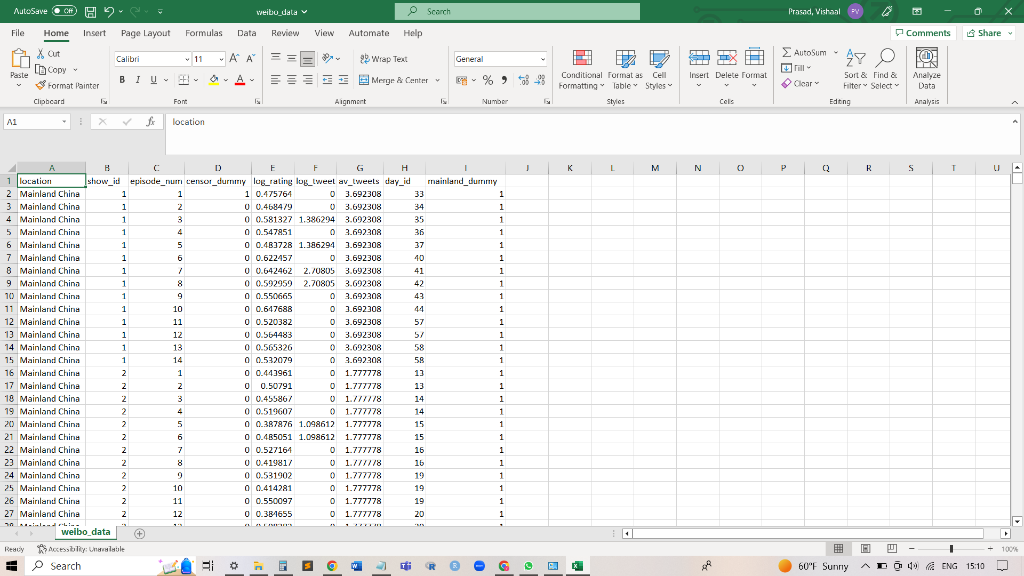
Note: This is a screenshot of the dataset. It is too large to be directly pasted here since there aren't enough characters. If there is any other way to share the dataset, please let me know!
Write the code for all regressions in the following questions in Python language in the Jupyter Notebooks environment:
1) Measuring the impact of online word-of-mouth You are trying to measure the impact of online word-of-mouth on product demand in the Chinese TV market. Specifically, you are interested in finding out whether consumers tweets about a TV show lead to higher viewership of the show. You obtain episode-level data of ratings (market share in terms of viewership) for a large set of TV shows as well as information on the number of tweets on Sina Weibo (the Chinese version of Twitter) mentioning the name of the show on the day on which a specific episode aired. You also have data on ratings for a set of shows in Hong Kong, where Sina Weibo has almost no market penetration because Hong Kong residents mainly use Twitter (which is blocked in mainland China).
Use the data-set weibo_data.csv file, which contains 9 columns as follows: i) location, ii) show_id, iii) episode_num, iv) censor_dummy, v) log_rating, vi) log_tweet, vii) av_tweets, viii) day_id, and ix) mainland_dummy
1.1 Simple regression Question 1. Load the data and regress (log) ratings of each show onto the (log) number of tweets per episode in Python. Do you think this regression gives you the causal effect of tweets on show viewership? If not, do you think your estimate will be biased upwards or downwards?
1.2 Geographic Diff-in-diff Question 1. During the time period of your data, the Chinese government blocked the entire Sina Weibo platform due to a political scandal for three days (a dummy for those three days called censor_dummy is included in the data). Assume that the censorship constitutes an exogenous shock that affected the number of tweets during the three days it lasted. You want to exploit this shock in order to analyze whether ratings decreased during the censorship.
(a) Run a regression of episode-level (log) ratings on show fixed effects and the censorship dummy using only data from mainland China in Python. Interpret the coefficient on the censorship dummy. Is this result what you expected?
(b) Was it necessary to control for show fixed effects in the regression above? If you ran the regression without show fixed effects, how would the interpretation of the coefficient on the censorship dummy differ?
(c) Run the same regression as in part (a), but use only data from Hong Kong (and not mainland China) in Python. Make sure to control for show fixed effects. Interpret the coefficient on the censorship dummy. Is this result what you expected?
(d) Using data from both Hong Kong and mainland China, implement a difference-in-differences regression with mainland China as the treatment group and Hong Kong as the control group in Python. In other words, you want to show that the censorship event had a differential effect in mainland China relative to Hong Kong. Make sure to control for show fixed effects. Interpret the relevant coefficients of this regression.
1.3 Across-show Diff-in-diff From this question onward, use only observations from shows in mainland China.
Question 1. The variable av_tweets denotes the average number of tweets associated with an episode of each show (outside of the censored time period). Therefore, this variable is show specific, but it does not vary over time. We can use this variable to capture the general level of social media interest in each show.
Generate a set of three dummy variables based on the av tweets variable: The first dummy is equal to one for shows with fewer than 5 tweets per episode, the second dummy is equal to one for shows with at least 5 but less than 100 tweets per episode, and the third dummy should be equal to one for shows with at least 100 tweets per episode.
(a) Run three separate regressions for shows with less than 5 tweets per episode, shows with 5 to 100 tweets per episode and shows with at least 100 tweets (all in Python). What do you find in terms of impact of the censorship event across the three regressions?
(b) Run a difference-in-difference regression that allows for the censorship event to have a different effect for three sets of shows with the three different activity levels defined above in Python. Interpret the relevant coefficients.
(c) Relate your findings across shows with different activity levels to the geographic difference-in-difference approach. Which regression is more informative regarding the impact of the censorship on ratings?
Step by Step Solution
There are 3 Steps involved in it
Step: 1

Get Instant Access to Expert-Tailored Solutions
See step-by-step solutions with expert insights and AI powered tools for academic success
Step: 2

Step: 3
Ace Your Homework with AI
Get the answers you need in no time with our AI-driven, step-by-step assistance
Get Started