Answered step by step
Verified Expert Solution
Question
1 Approved Answer
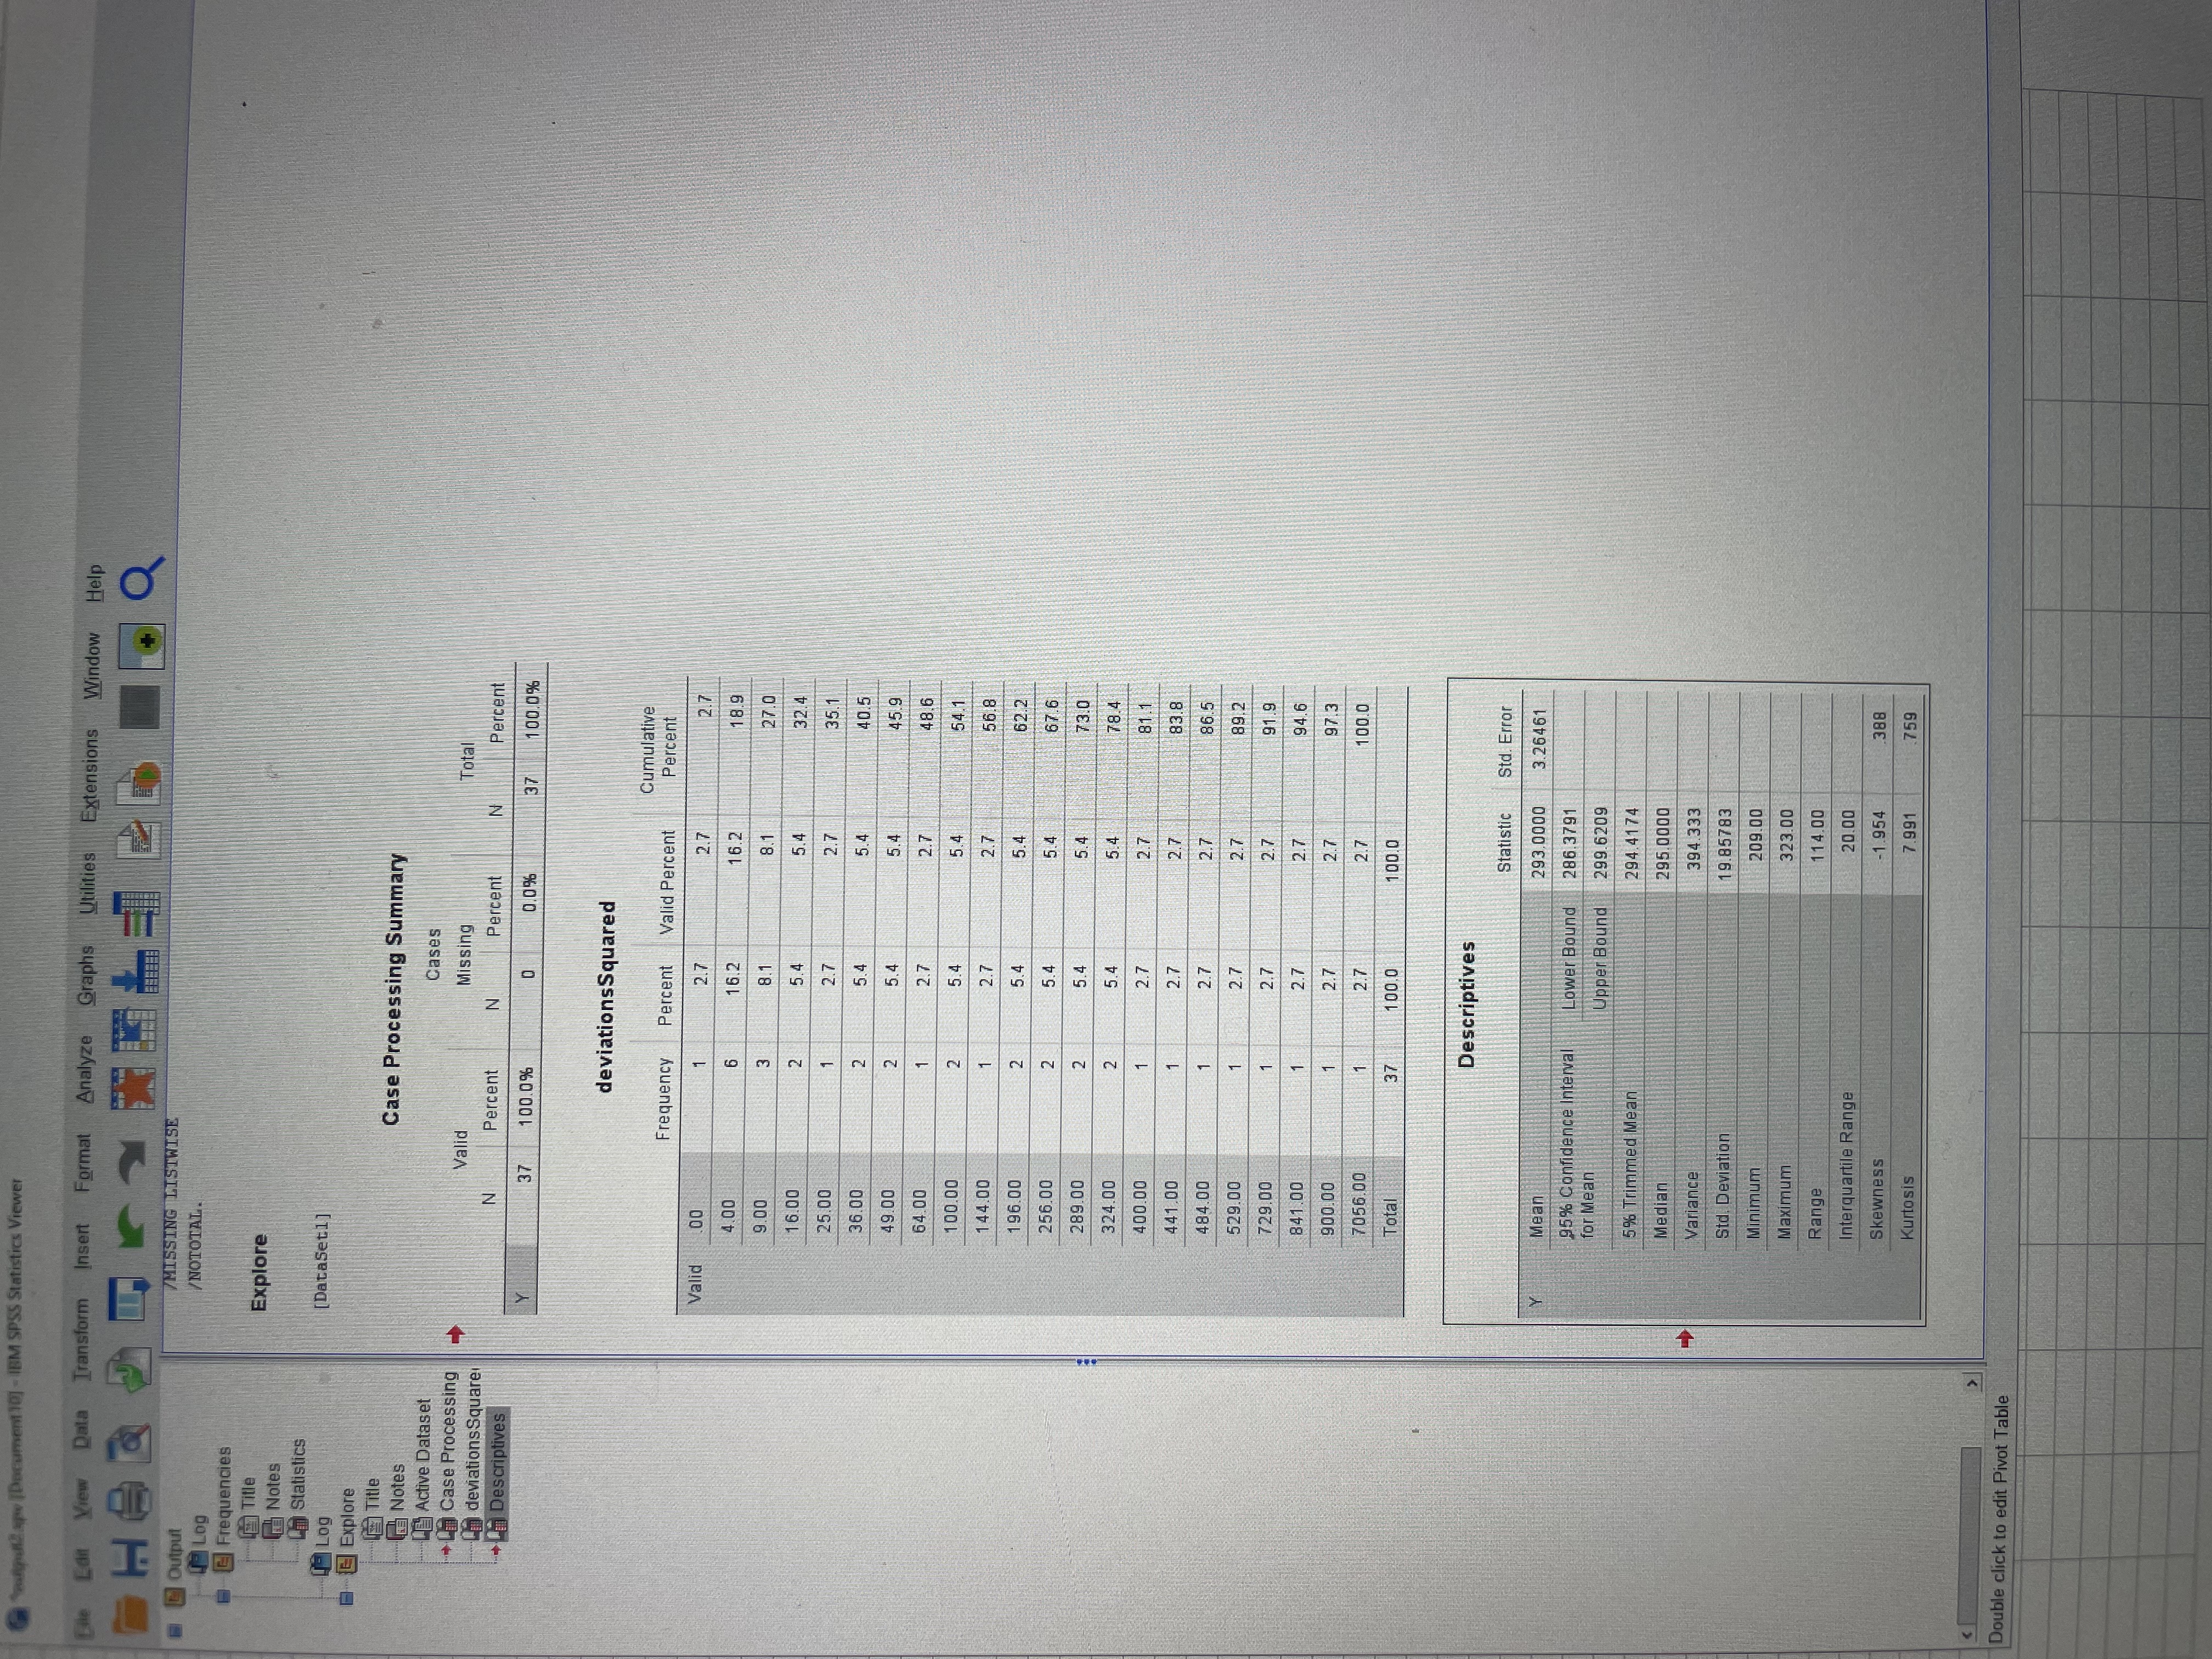
Notice that SPSS gives you several awesome statistics, including the 95% Confidence Interval of m. notice that lower bound indicates the lower boundary of the
Notice that SPSS gives you several awesome statistics, including the 95% Confidence Interval of m. notice that "lower bound" indicates the lower boundary of the confidence interval, while "upper bound" indicates the upper boundary of the confidence interval.
M = est.? = ?
95% Confidence Interval: ? ? ? ? __
95% Confidence Interval: ___ ? ? ? _?__
Variance = ?
Standard Deviation = ?
The SPSS "Variance" is
Group of answer choices
A. The estimate of the population variance (i.e. est. ?2)
B. The variance of the sample (i.e. S2)
DJ - IBM SPSS Statistics Viewer Lile Edit View Data Transform Insert Format Analyze Graphs Utilities Extensions Window Help LE BED.Q Output MISSING LISTWISE Log /NOTOTAL- Frequencies Title Explore Notes Statistics Log [DataSet1] Explore Title my Notes Case Processing Summary Active Dataset Cases Case Processing Valid Total deviations Square Missing Descriptives Percent Percent N Percent 37 100.09% 0.0% 37 100.0% deviationsSquared Cumulative Frequency Percent Valid Percent Percent Valid .00 2.7 2.7 2.7 4.00 6 16.2 16.2 18.9 9.00 3 8.1 8.1 27.0 16.00 2 5.4 5.4 32.4 25.00 2.7 2.7 35.1 36.00 2 5.4 5.4 40.5 49.00 2 5.4 5.4 45.9 64.00 2.7 2.7 48.6 100.00 2 5.4 5.4 54.1 144.00 1 2.7 2.7 56.8 196.00 5.4 5.4 62.2 256.00 2 5.4 5.4 676 289.00 5.4 5.4 73.0 324.00 N I 5.4 5.4 78.4 400.00 2.7 2. 7 81.1 441.00 2.7 2.7 83.8 484.00 2.7 2.7 86.5 529.00 1 2.7 2.7 89.2 729.00 2.7 2.7 91.9 841.00 2.7 2.7 94.6 900.00 2.7 2.7 97 3 7056.00 2.7 2.7 100.0 Total 37 100.0 100 0 Descriptives Statistic Std. Error Mean 293,0000 3.26461 95% Confidence Interval Lower Bound 286 3791 for Mean Upper Bound 299.6209 5% Trimmed Mean 294.4174 Median 295,0000 Variance 394.333 Std Deviation 19.85783 Minimum 209.00 Maximum 323.00 Range 114.00 Interquartile Range 20.00 Skewness -1.954 388 Kurtosis 7.991 759 Double click to edit Pivot Table
Step by Step Solution
There are 3 Steps involved in it
Step: 1
Get Instant Access to Expert-Tailored Solutions
See step-by-step solutions with expert insights and AI powered tools for academic success
Step: 2
Step: 3
Ace Your Homework with AI
Get the answers you need in no time with our AI-driven, step-by-step assistance
Get Started