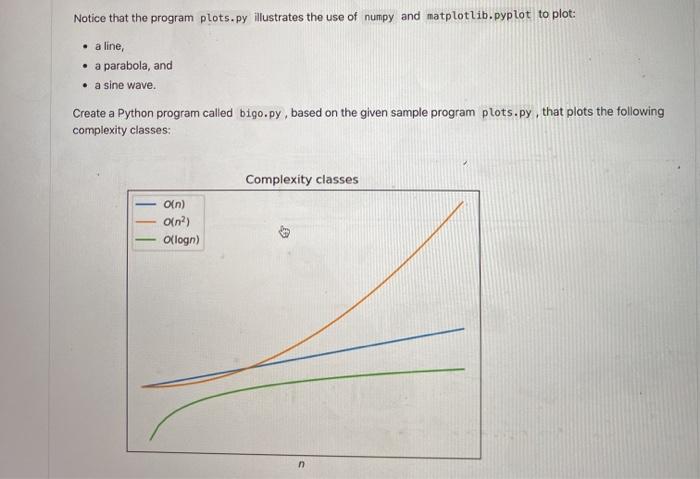
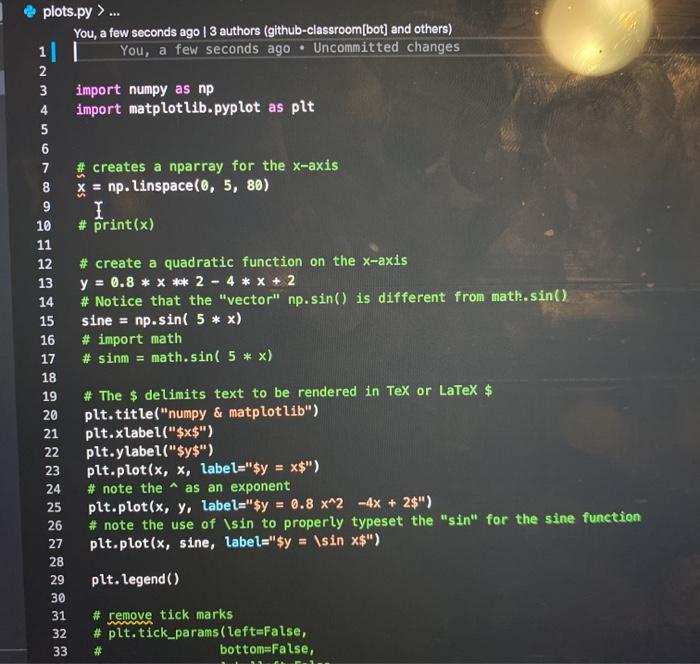
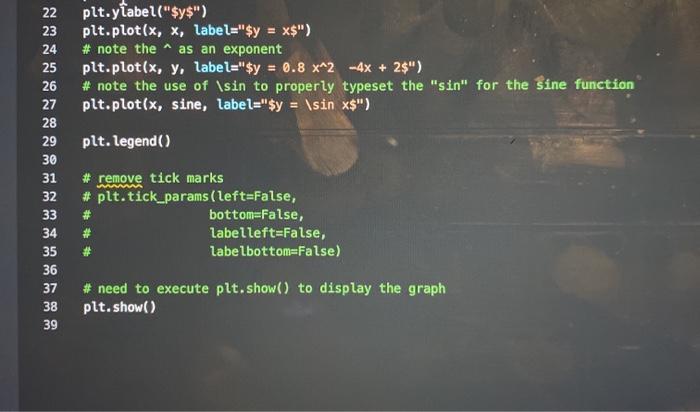
Notice that the program plots.py illustrates the use of numpy and matplotlib.pyplot to plot: a line, . a parabola, and a sine wave. Create a Python program called bigo.py, based on the given sample program plots.py, that plots the following complexity classes: Complexity classes Oin) Oin?) Ollogn) n plots.py ... You, a few seconds ago 1 3 authors (github-classroom[bot] and others) 1 L You, a few seconds ago. Uncommitted changes 2 3 import numpy as np import matplot lib.pyplot as plt 4 6 7 8 # creates a nparray for the x-axis x = np. linspace(0, 5, 80) I # Print(x) 9 # create a quadratic function on the x-axis y = 0.8 * X ** 2 - 4 * x + 2 # Notice that the "vector" np.sin() is different from math.sin(). sine = np.sin( 5 * x) # import math # sinm = math.sin( 5 * x) 10 11 12 13 14 15 16 17 18 19 20 21 22 23 24 25 26 27 28 29 30 31 32 33 # The $ delimits text to be rendered in Tex or Latex $ plt.title("numpy & matplotlib") plt.xlabel("$x$") plt.ylabel("$y$") plt.plot(x, x, label="$y = x$") # note the ^ as an exponent plt.plot(x, y, label="$y = 0.8 x^2 - 4x + 2$") # note the use of \sin to properly typeset the "sin" for the sine function plt.plot(x, sine, label="$y = \sin x$") plt. Legend() # remove tick marks # plt.tick_params(left=False, bottom=False, # 22 23 24 25 26 27 28 29 30 31 plt.yabel("$y$") plt.plot(x, x, label="$y = x$") # note the ^ as an exponent plt.plot(x, y, label="$y = 0.8 X^2 -4x + 2$") # note the use of \sin to properly typeset the "sin" for the sine function plt.plot(x, sine, label="$y = \sin x$") plt. legend() 32 * remove tick marks # plt.tick_params (left=False, bottom=False, Labelleft=False, labelbottom=False) # # 33 34 35 36 37 38 39 # need to execute plt.show() to display the graph plt.show()