Answered step by step
Verified Expert Solution
Question
1 Approved Answer
Now compute all the liquidity and working management ratios ( minumum of 10 ratios in total ) and give your analysis and recommendations( analysis and

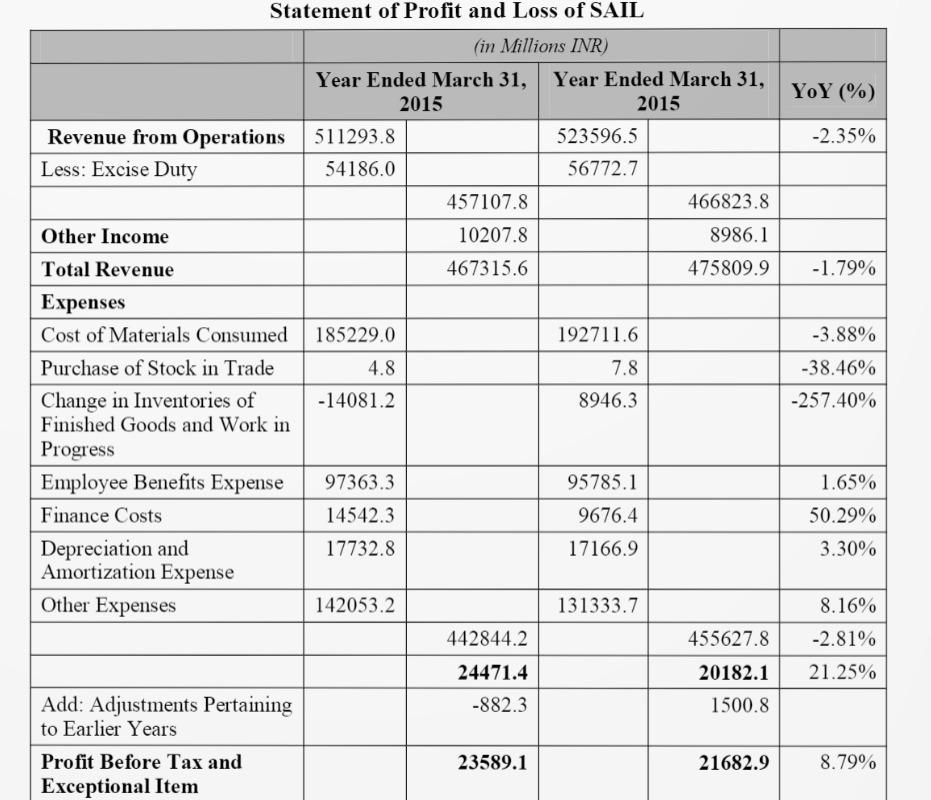

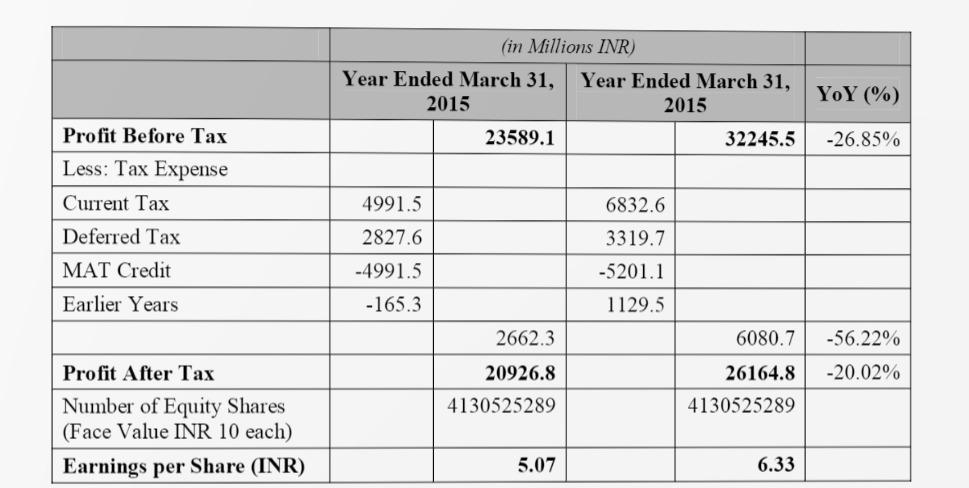
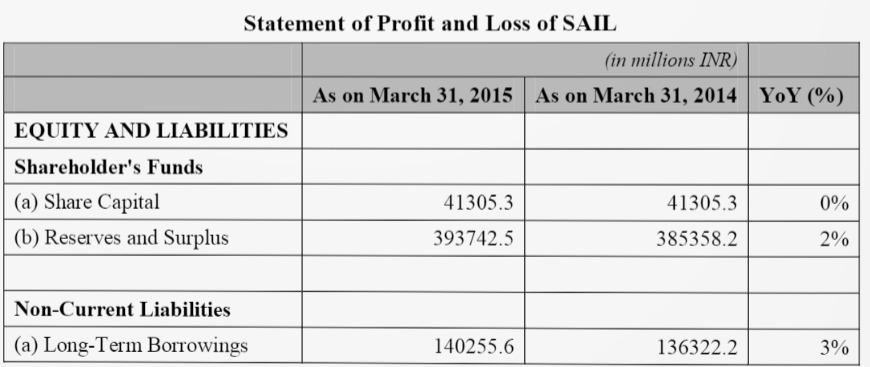
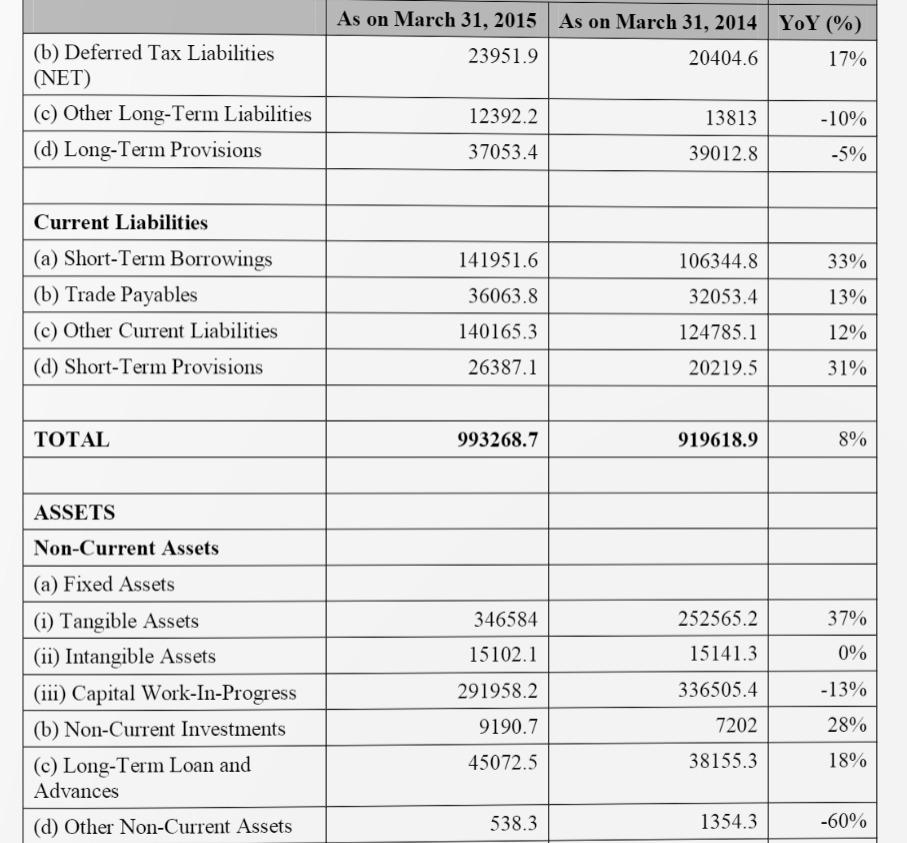
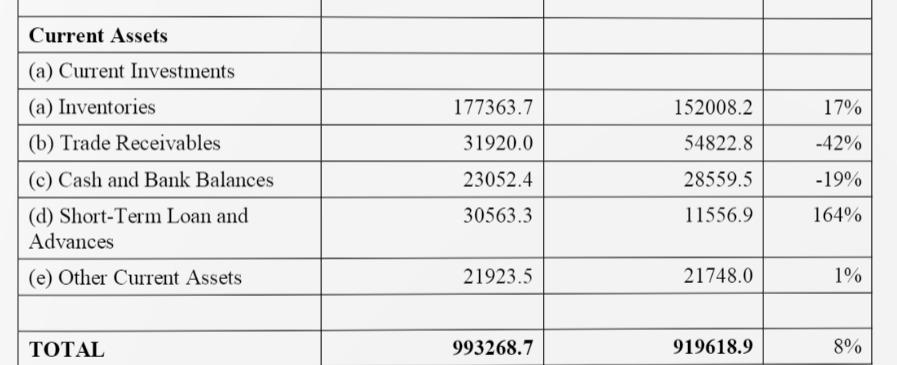
Now compute all the liquidity and working management ratios ( minumum of 10 ratios in total ) and give your analysis and recommendations( analysis and recommendations should be explained in brief)
Stores and Spares Raw Material Work-in-progress Finished Goods Total Schedule of Inventory at SAIL (in Millions INR) As on March 31, 2015 As on March 31, 2014 27888.1 27079.9 43321.8 35213.1 33128 24374.2 73025.8 65341 177363.7 152008.2 YoY (%) 2.98% 23.03% 35.91% 11.76% 16.68% YoY (%) Statement of Profit and Loss of SAIL (in Millions INR) Year Ended March 31, Year Ended March 31, 2015 2015 Revenue from Operations 511293.8 523596.5 Less: Excise Duty 54186.0 56772.7 457107.8 466823.8 -2.35% 10207.8 467315.6 8986.1 475809.9 -1.79% -3.88% 192711.6 7.8 8946.3 -38.46% -257.40% Other Income Total Revenue Expenses Cost of Materials Consumed 185229.0 Purchase of Stock in Trade 4.8 Change in Inventories of -14081.2 Finished Goods and Work in Progress Employee Benefits Expense 97363.3 Finance Costs 14542.3 Depreciation and 17732.8 Amortization Expense Other Expenses 142053.2 95785.1 9676.4 1.65% 50.29% 3.30% 17166.9 131333.7 8.16% 442844.2 455627.8 -2.81% 24471.4 20182.1 21.25% -882.3 1500.8 Add: Adjustments Pertaining to Earlier Years Profit Before Tax and Exceptional Item 23589.1 21682.9 8.79% 10562.6 Add: Exceptional Item Compensation received for Non-Performance of Contract (in Millions INR) Year Ended March 31, Year Ended March 31, 2015 2015 23589.1 32245.5 YoY (%) -26.85% 4991.5 Profit Before Tax Less: Tax Expense Current Tax Deferred Tax MAT Credit Earlier Years 6832.6 3319.7 2827.6 -4991.5 -165.3 -5201.1 1129.5 2662.3 6080.7 -56.22% 26164.8 -20.02% 20926.8 4130525289 4130525289 Profit After Tax Number of Equity Shares (Face Value INR 10 each) Earnings per Share (INR) 5.07 6.33 Statement of Profit and Loss of SAIL (in millions INR) As on March 31, 2015 As on March 31, 2014 YoY (%) EQUITY AND LIABILITIES Shareholder's Funds (a) Share Capital (b) Reserves and Surplus 41305.3 41305.3 0% 393742.5 385358.2 2% Non-Current Liabilities (a) Long-Term Borrowings 140255.6 136322.2 3% As on March 31, 2015 23951.9 As on March 31, 2014 YoY (%) 20404.6 17% (b) Deferred Tax Liabilities (NET) (c) Other Long-Term Liabilities (d) Long-Term Provisions 13813 -10% 12392.2 37053.4 39012.8 -5% Current Liabilities 141951.6 106344.8 33% (a) Short-Term Borrowings (b) Trade Payables 36063.8 32053.4 13% (c) Other Current Liabilities 124785.1 12% 140165.3 26387.1 (d) Short-Term Provisions 20219.5 31% TOTAL 993268.7 919618.9 8% ASSETS 346584 252565.2 37% 15102.1 15141.3 0% Non-Current Assets (a) Fixed Assets (i) Tangible Assets (ii) Intangible Assets (iii) Capital Work-In-Progress (b) Non-Current Investments (c) Long-Term Loan and Advances (d) Other Non-Current Assets 291958.2 336505.4 -13% 9190.7 7202 28% 45072.5 38155.3 18% 538.3 1354.3 -60% Current Assets (a) Current Investments (a) Inventories 177363.7 152008.2 17% 31920.0 54822.8 -42% 23052.4 28559.5 -19% (b) Trade Receivables (c) Cash and Bank Balances (d) Short-Term Loan and Advances 30563.3 11556.9 164% (e) Other Current Assets 21923.5 21748.0 1% TOTAL 993268.7 919618.9 8%Step by Step Solution
There are 3 Steps involved in it
Step: 1

Get Instant Access to Expert-Tailored Solutions
See step-by-step solutions with expert insights and AI powered tools for academic success
Step: 2

Step: 3

Ace Your Homework with AI
Get the answers you need in no time with our AI-driven, step-by-step assistance
Get Started


