Answered step by step
Verified Expert Solution
Question
1 Approved Answer
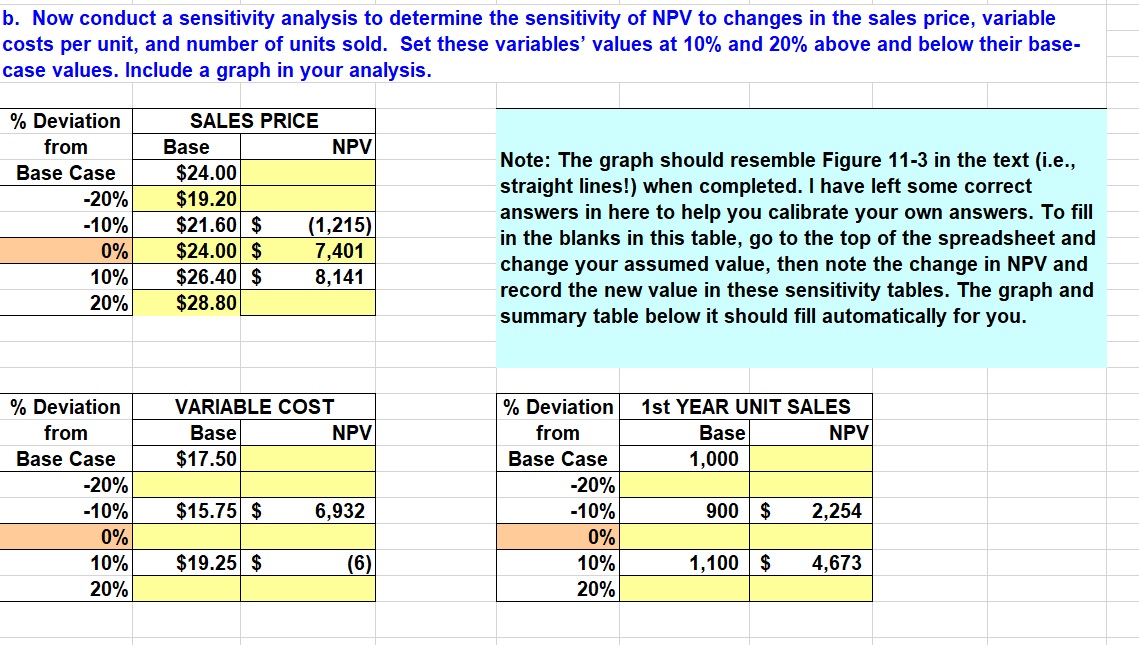
Now conduct a sensitivity analysis to determine the sensitivity of NPV to changes in the sales price, variable osts per unit, and number of units
 Now conduct a sensitivity analysis to determine the sensitivity of NPV to changes in the sales price, variable osts per unit, and number of units sold. Set these variables' values at 10% and 20% above and below their basease values. Include a graph in your analysis. Note: The graph should resemble Figure 11-3 in the text (i.e., straight lines!) when completed. I have left some correct answers in here to help you calibrate your own answers. To fill in the blanks in this table, go to the top of the spreadsheet and change your assumed value, then note the change in NPV and record the new value in these sensitivity tables. The graph and summary table below it should fill automatically for you. Now conduct a sensitivity analysis to determine the sensitivity of NPV to changes in the sales price, variable osts per unit, and number of units sold. Set these variables' values at 10% and 20% above and below their basease values. Include a graph in your analysis. Note: The graph should resemble Figure 11-3 in the text (i.e., straight lines!) when completed. I have left some correct answers in here to help you calibrate your own answers. To fill in the blanks in this table, go to the top of the spreadsheet and change your assumed value, then note the change in NPV and record the new value in these sensitivity tables. The graph and summary table below it should fill automatically for you
 Step by Step Solution
There are 3 Steps involved in it
Step: 1

Get Instant Access to Expert-Tailored Solutions
See step-by-step solutions with expert insights and AI powered tools for academic success
Step: 2

Step: 3

Ace Your Homework with AI
Get the answers you need in no time with our AI-driven, step-by-step assistance
Get Started


