

Question
Now, imagine that you want to re-create the second graph for yourself by writing some R code. You want the different -vores to be depicted
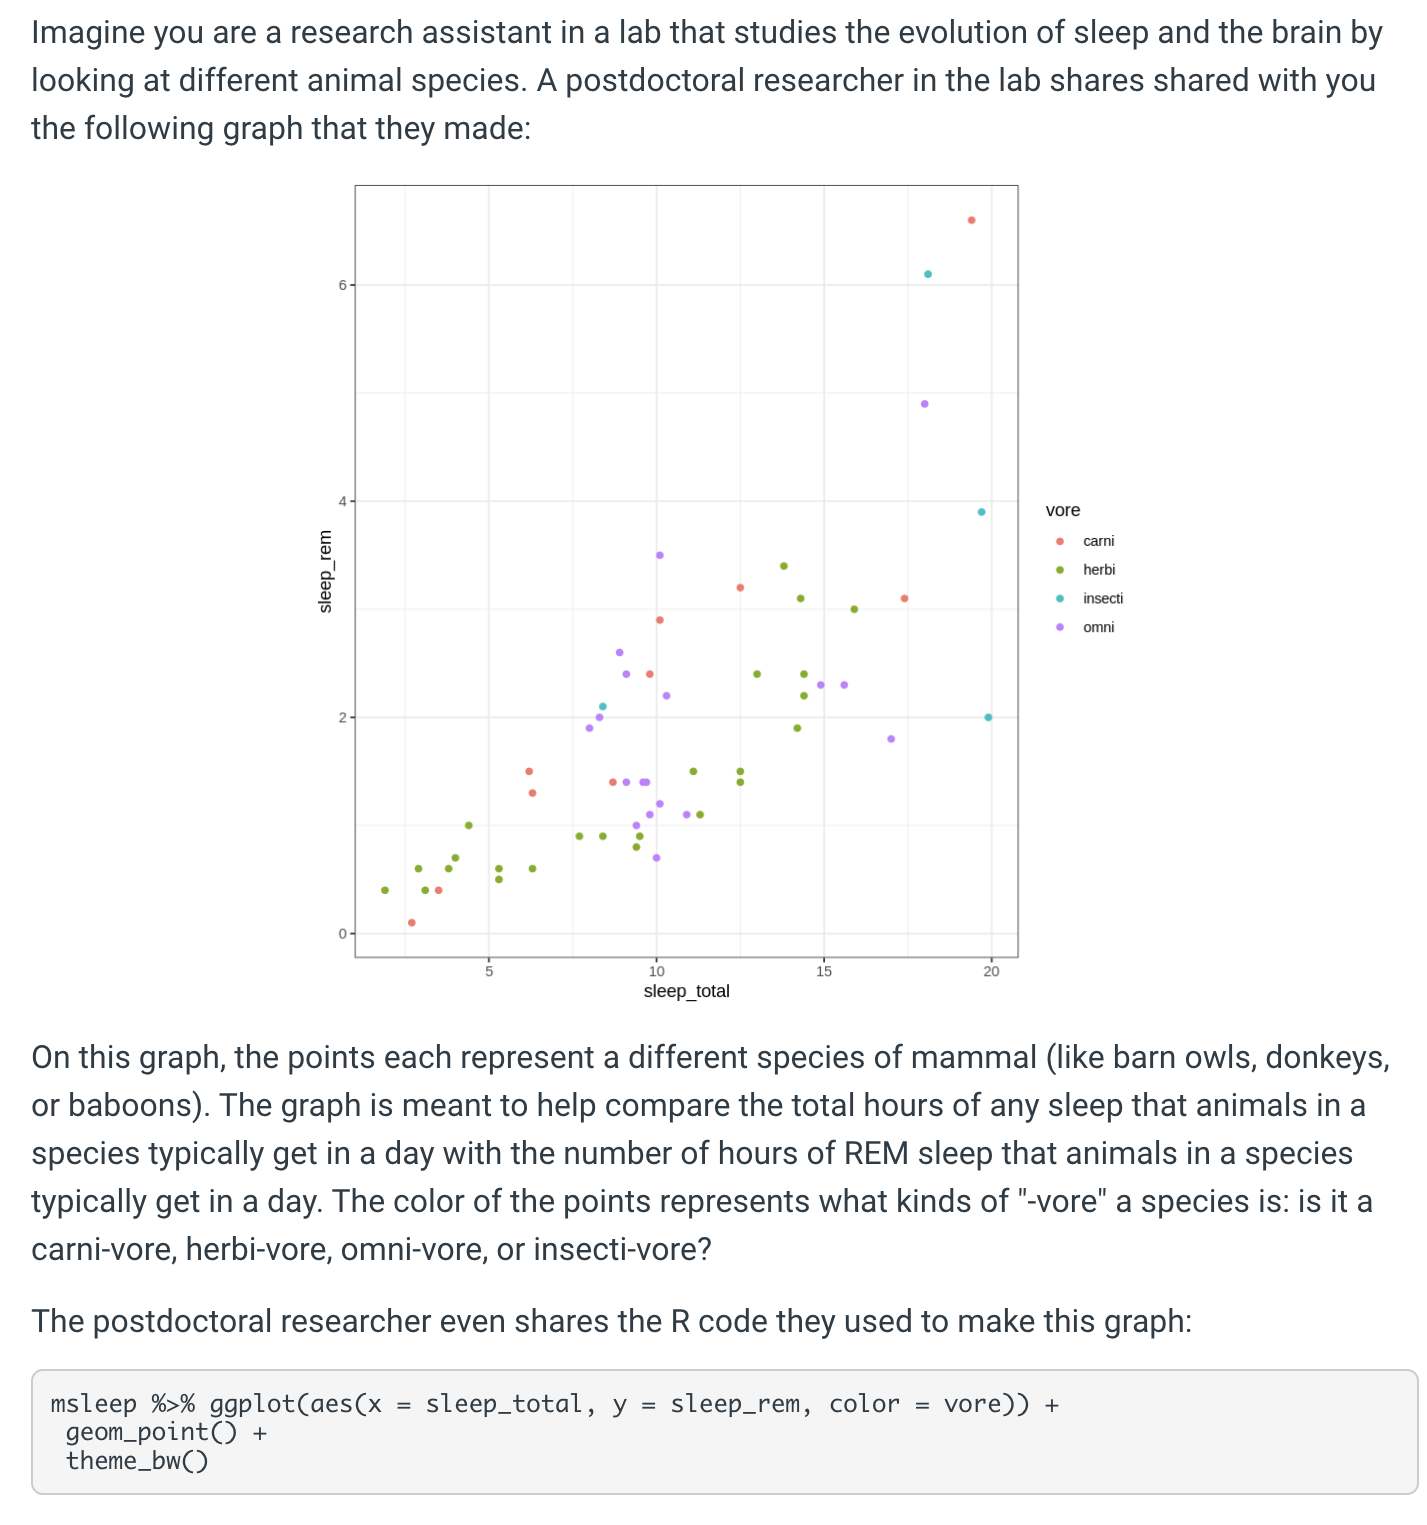
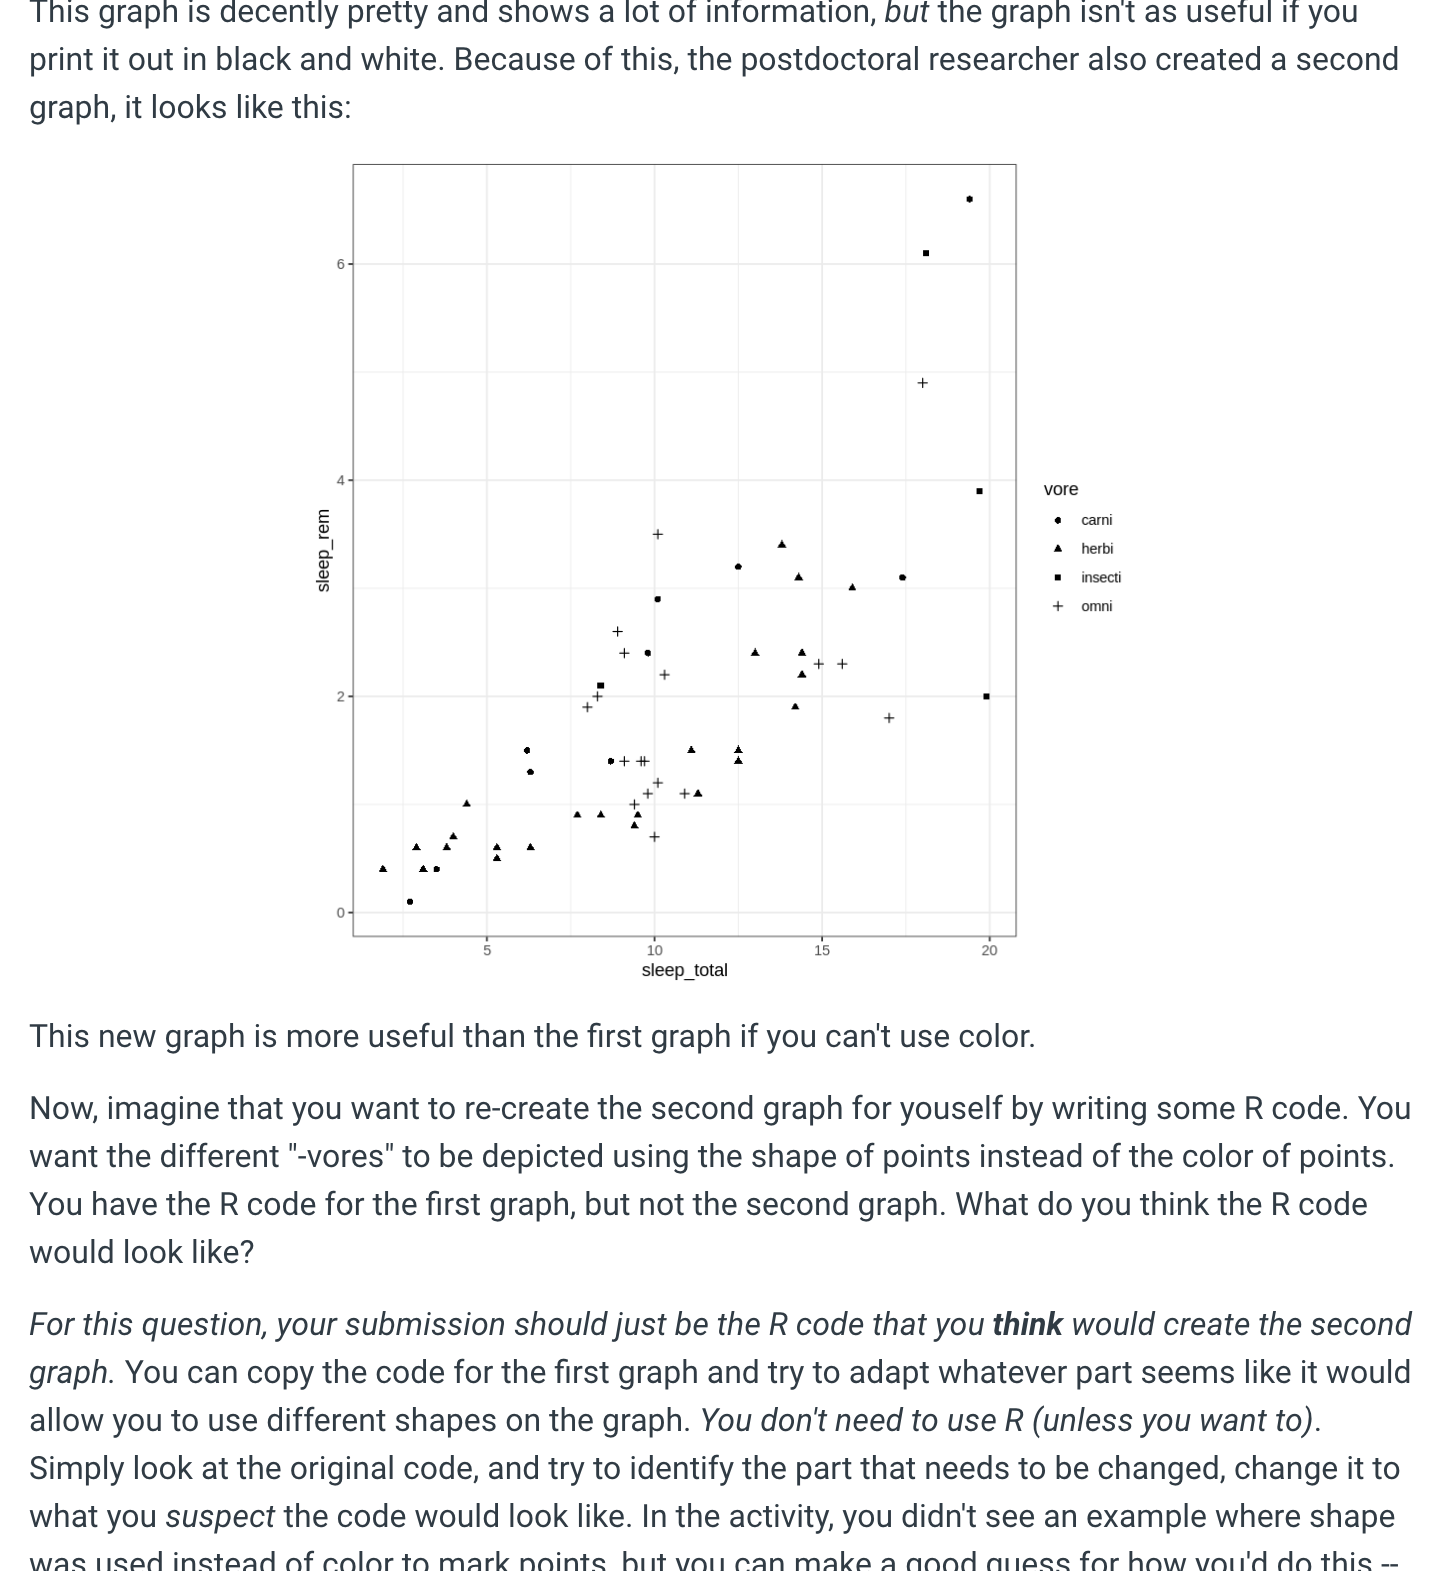
Now, imagine that you want to re-create the second graph for yourself by writing some R code. You want the different "-vores" to be depicted using the shape of points instead of the color of points. You have the R code for the first graph, but not the second graph. What do you think the R code would look like?
For this question, the submission should just be the R code that one would create for the second graph.You can copy the code for the first graph and try to adapt whatever part seems like it would allow using of different shapes on the graph.You don't need to use R . Simply look at the original code, and try to identify the part that needs to be changed, changing it to what is suspectedthe code would look like.
Step by Step Solution
There are 3 Steps involved in it
Step: 1

Get Instant Access to Expert-Tailored Solutions
See step-by-step solutions with expert insights and AI powered tools for academic success
Step: 2

Step: 3
Ace Your Homework with AI
Get the answers you need in no time with our AI-driven, step-by-step assistance
Get Started
Essentials of Business Analytics
Authors: Jeffrey D. Camm, James J. Cochran, Michael J. Fry, Jeffrey W. Ohlmann, David R. Anderson
2nd edition
1305627733, 978-1305861817, 1305861817, 978-0357688960, 978-1305627734