Question
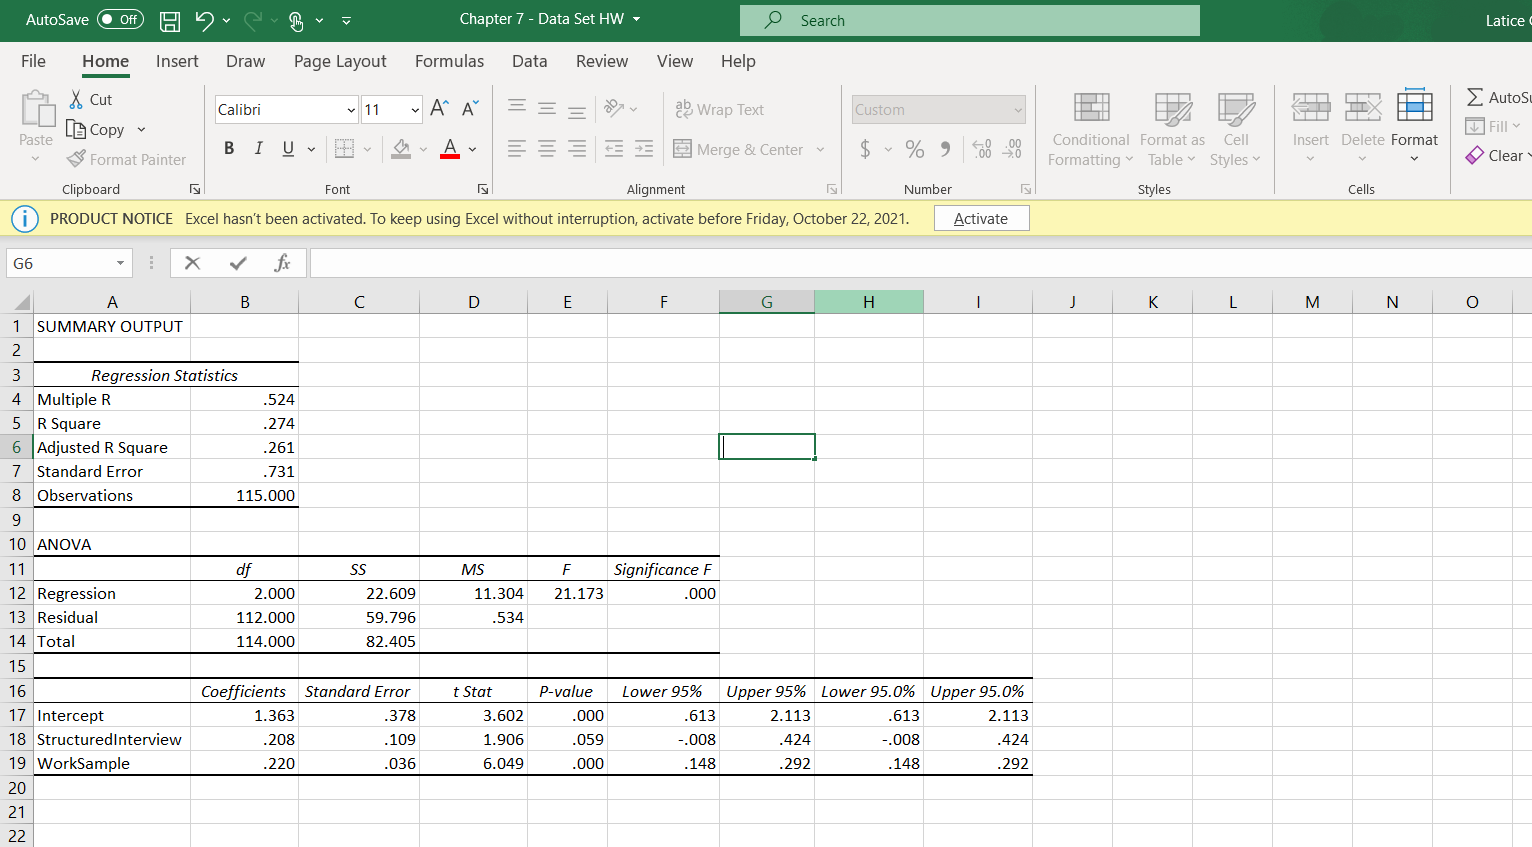
Now its time assess the following: whether there is any redundancy between the two selection procedure variables (i.e., is there a very large correlation between
 Now its time assess the following: whether there is any redundancy between the two selection procedure variables (i.e., is there a very large correlation between the two?), if both are still significantly associated with job performance when specified in the same regression model (p-value), and what the collective criterion-related validity of the selection procedures are in terms of the R-squared value. Once you have run the analyses, respond to the following questions: 1. Is there any concerning amount of redundancy between scores on the structured interview and scores on the work sample? How do you know? Be specific and use numbers to support your answers. 2. Are both selection procedure variables still significantly associated with job performance when specified in the same multiple linear regression model? How do you know? 3. What is the R-squared value for the model? What does this value indicate? 4. Do you recommend that the organization use both selection procedures in the future? Why or why not? 5. Describe what you did to a manager. Remember that the manager is not well- versed in data analytics, so you have to use lay terms to help them understand your procedure, results, and what they mean.
Step by Step Solution
There are 3 Steps involved in it
Step: 1

Get Instant Access to Expert-Tailored Solutions
See step-by-step solutions with expert insights and AI powered tools for academic success
Step: 2

Step: 3

Ace Your Homework with AI
Get the answers you need in no time with our AI-driven, step-by-step assistance
Get Started


