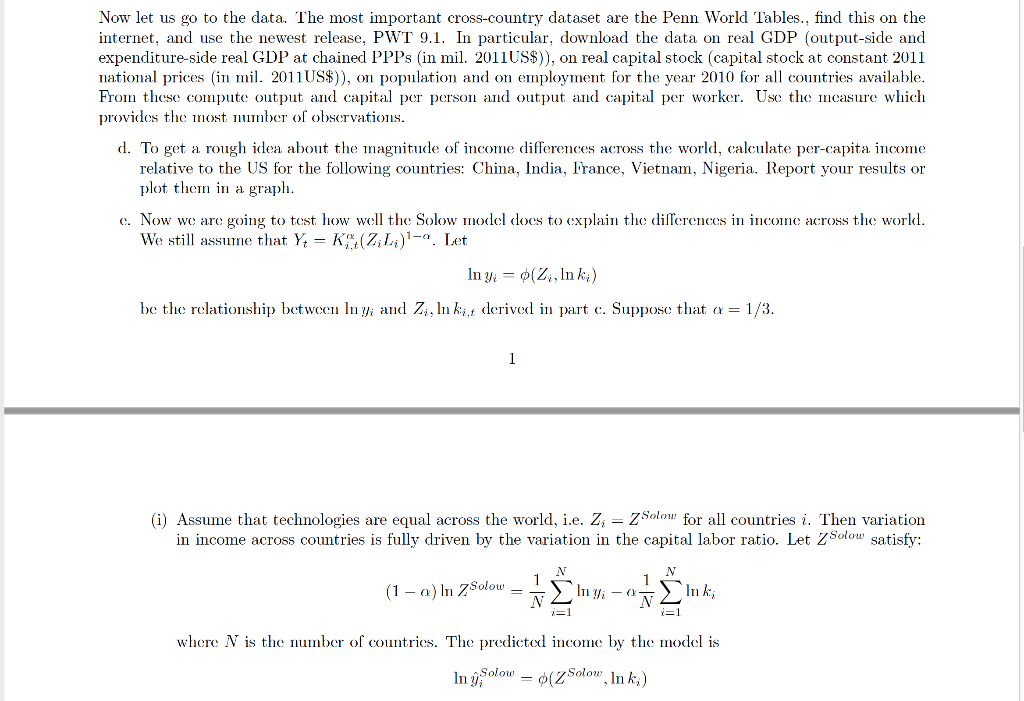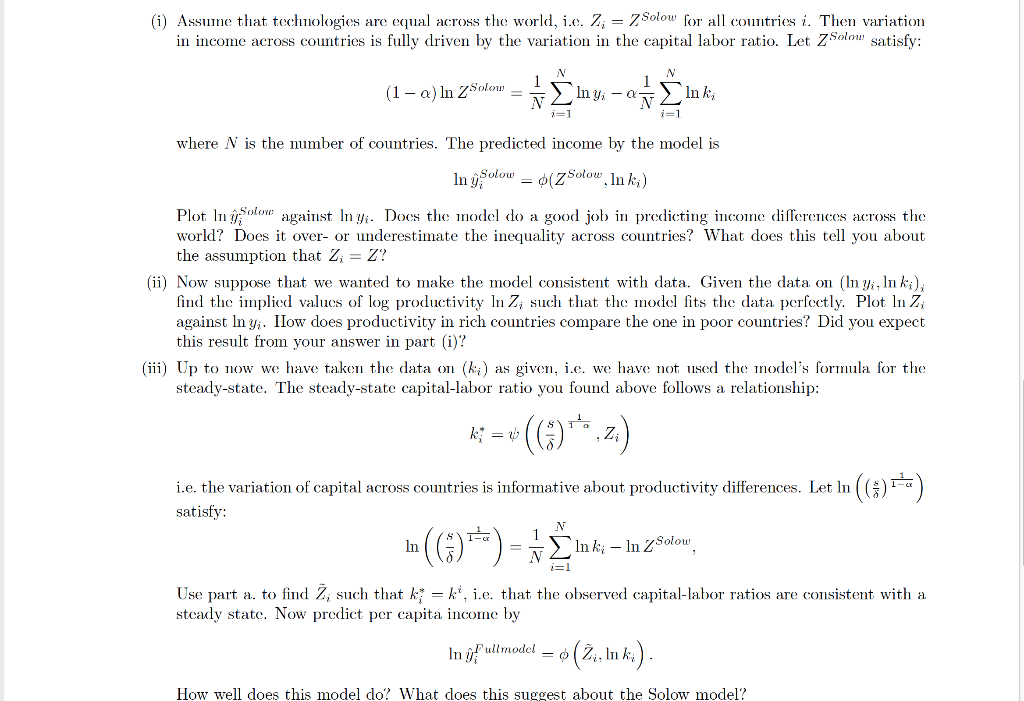

Now let us go to the data. The most important cross-country dataset are the Penn World Tables., find this on the internet, and use the newest release, PWT 9.1. In particular, download the data on real GDP (output-side and expenditure-side real GDP at chained PPPs (in mil. 2011US\$)), on real capital stock (capital stock at constant 2011 national prices (in mil. 2011US\$)), on population and on employment for the year 2010 for all countries available. From these compute output and capital per person and output and capital per worker. Use the measure which provides the most mumber of observations. d. To get a rough idea about the magnitude of income differences across the world, calculate per-capita income relative to the US for the following countries: China, India, France, Vietnam, Nigeria. Report your results or plot them in a graph. e. Now we are going to test how well the Solow model does to explain the differences in income across the world. We still assume that Yt=Ki,tx(ZiLi)1. Let lnyi=(Zi,lnki) be the relationship between lnyi and Zi,lnki,t derived in part c. Suppose that =1/3. (i) Assume that technologies are equal across the world, i.e. Zi=ZSolow for all countries i. Then variation in income across countries is fully driven by the variation in the capital labor ratio. Let ZSolow satisfy: (1)lnZSolow=N1i=1NlyiN1i=1Nlnki where N is the number of countries. The predicted income by the model is lny^iSolow=(ZSolow,lnki) (i) Assumne that technologies are equal across the world, i.e. Zi=ZSolow for all countries i. Then variation (1)lnZSolow=N1i=1NlnyiN1i=1Nlnki where N is the number of countries. The predicted income by the model is lny^iSolow=(ZSolow,lnki) Plot lny^iSolow against lnyi. Does the model do a good job in predicting income differences across the world? Does it over- or underestimate the inequality across countries? What does this tell you about the assumption that Zi=Z ? (ii) Now suppose that we wanted to make the model consistent with data. Given the data on (lnyi,lnki)i find the implied values of log productivity lnZi such that the model fits the data perfectly. Plot lnZi against lnyi. IIow does productivity in rich countries compare the one in poor countries? Did you expect this result from your answer in part (i)? (iii) Up to now we have taken the data on (ki) as given, i.e. we have not. used the model's formula for the steady-state. The steady-state capital-labor ratio you found above follows a relationship: ki=((s)11,Zi) i.e. the variation of capital across countries is informative about productivity differences. Let ln((s)11) satisfy: ln((s)11)=N1i=1NlnkilnZSolow, Use part a. to find Z~i such that ki=ki, i.e. that the observed capital-labor ratios are consistent with a steady state. Now predict per capita income by lny^iFullmodel=(Z~i,lnki). Now let us go to the data. The most important cross-country dataset are the Penn World Tables., find this on the internet, and use the newest release, PWT 9.1. In particular, download the data on real GDP (output-side and expenditure-side real GDP at chained PPPs (in mil. 2011US\$)), on real capital stock (capital stock at constant 2011 national prices (in mil. 2011US\$)), on population and on employment for the year 2010 for all countries available. From these compute output and capital per person and output and capital per worker. Use the measure which provides the most mumber of observations. d. To get a rough idea about the magnitude of income differences across the world, calculate per-capita income relative to the US for the following countries: China, India, France, Vietnam, Nigeria. Report your results or plot them in a graph. e. Now we are going to test how well the Solow model does to explain the differences in income across the world. We still assume that Yt=Ki,tx(ZiLi)1. Let lnyi=(Zi,lnki) be the relationship between lnyi and Zi,lnki,t derived in part c. Suppose that =1/3. (i) Assume that technologies are equal across the world, i.e. Zi=ZSolow for all countries i. Then variation in income across countries is fully driven by the variation in the capital labor ratio. Let ZSolow satisfy: (1)lnZSolow=N1i=1NlyiN1i=1Nlnki where N is the number of countries. The predicted income by the model is lny^iSolow=(ZSolow,lnki) (i) Assumne that technologies are equal across the world, i.e. Zi=ZSolow for all countries i. Then variation (1)lnZSolow=N1i=1NlnyiN1i=1Nlnki where N is the number of countries. The predicted income by the model is lny^iSolow=(ZSolow,lnki) Plot lny^iSolow against lnyi. Does the model do a good job in predicting income differences across the world? Does it over- or underestimate the inequality across countries? What does this tell you about the assumption that Zi=Z ? (ii) Now suppose that we wanted to make the model consistent with data. Given the data on (lnyi,lnki)i find the implied values of log productivity lnZi such that the model fits the data perfectly. Plot lnZi against lnyi. IIow does productivity in rich countries compare the one in poor countries? Did you expect this result from your answer in part (i)? (iii) Up to now we have taken the data on (ki) as given, i.e. we have not. used the model's formula for the steady-state. The steady-state capital-labor ratio you found above follows a relationship: ki=((s)11,Zi) i.e. the variation of capital across countries is informative about productivity differences. Let ln((s)11) satisfy: ln((s)11)=N1i=1NlnkilnZSolow, Use part a. to find Z~i such that ki=ki, i.e. that the observed capital-labor ratios are consistent with a steady state. Now predict per capita income by lny^iFullmodel=(Z~i,lnki)


