

Question
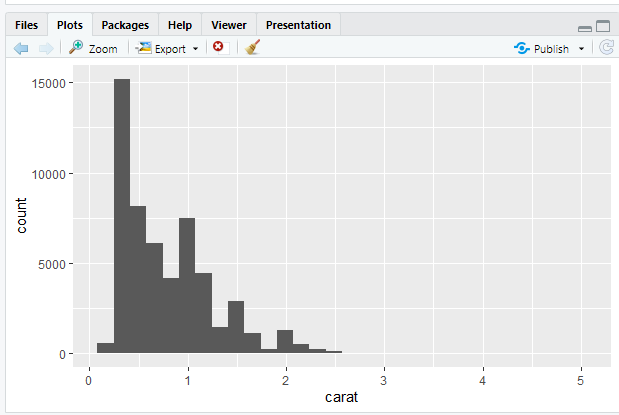
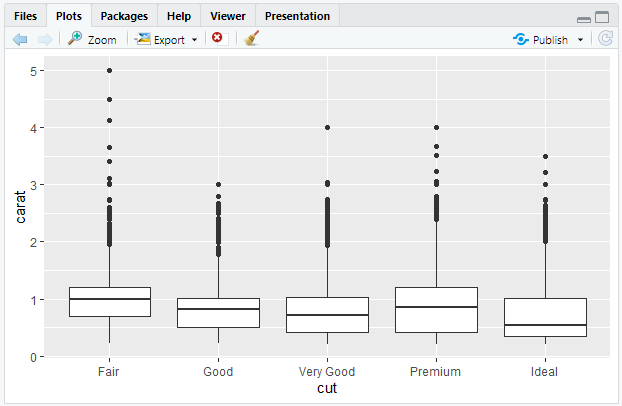
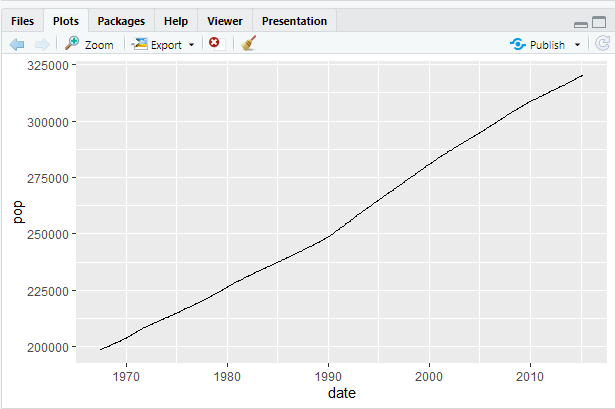
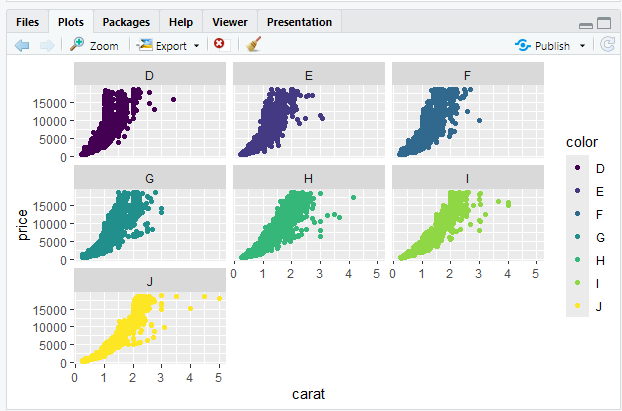
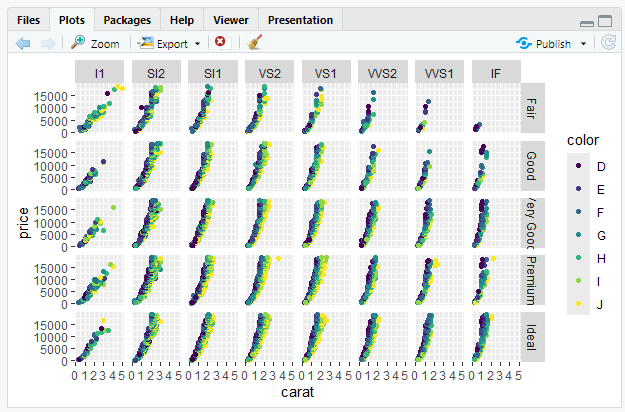
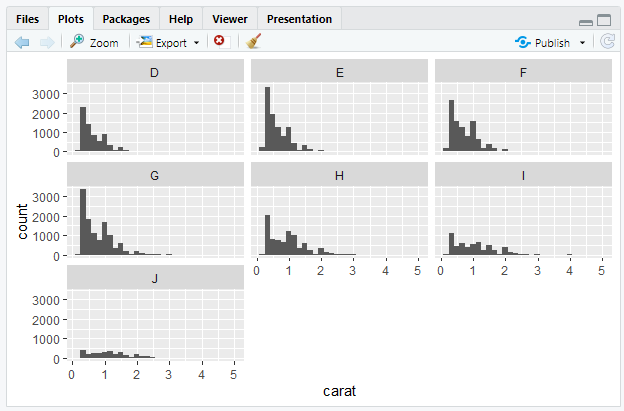
Now that the charts have been created, you can write two to three paragraphs that includes your analysis of each type of chart created above.
Now that the charts have been created, you can write two to three paragraphs that includes your analysis of each type of chart created above. Also, add a paragraph that describes how at least one of these chart(s) can be useful in a business environment/scenario.
Step by Step Solution
There are 3 Steps involved in it
Step: 1

Get Instant Access to Expert-Tailored Solutions
See step-by-step solutions with expert insights and AI powered tools for academic success
Step: 2

Step: 3
Ace Your Homework with AI
Get the answers you need in no time with our AI-driven, step-by-step assistance
Get Started
Business Analytics Data Analysis and Decision Making
Authors: S. Christian Albright, Wayne L. Winston
5th edition
1133629601, 9781285965529 , 978-1133629603