Question
Now we will focus on what happens when we try and use t-methods when the population is heavily skewed and the sample size is small.
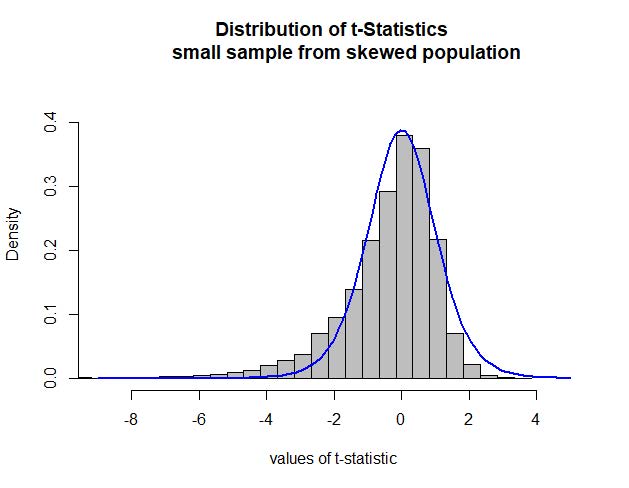
Now we will focus on what happens when we try and use t-methods when the population is heavily skewed and the sample size is small. Similar to question 1, a population was created that was heavily right skewed. Random samples of size 10 were taken and t-statistics for each sample was calculated. The histogram shows how these t-statistics are distributed and a t-distribution density curve is superimposed.
When the population is skewed and the sample size is small, we expect the distribution of sample means to be skewed as well and t-methods should not be used. Do you think it is a good idea to use a t-distribution to estimate the p-value when our sampling distribution is skewed? Explain. Consider describing the difference in p-values one would get when using the density curve compared to the histogram.
?

Step by Step Solution
There are 3 Steps involved in it
Step: 1

Get Instant Access to Expert-Tailored Solutions
See step-by-step solutions with expert insights and AI powered tools for academic success
Step: 2

Step: 3

Ace Your Homework with AI
Get the answers you need in no time with our AI-driven, step-by-step assistance
Get Started


