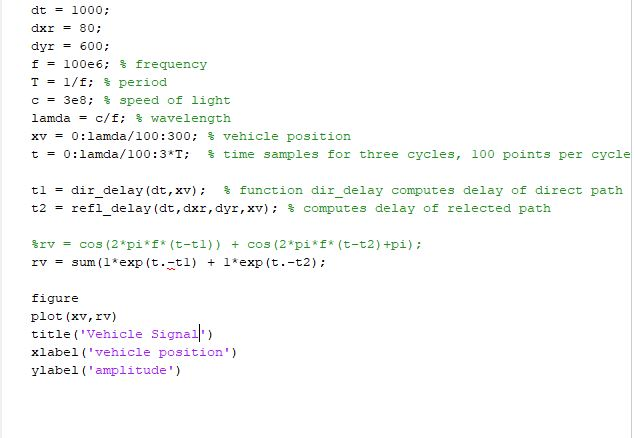


Now we will study the received signal strength - as measured by the received signal amplitude - as a function of vehicle position. This will reveal the impact of multipath propagation on communication quality. Express the sinusoids due to the direct and refiected paths as phasors in your MATLAB code and use the phasor addition rule to find the amplitude of the received signal. Plot the amplitude as a function of vehicle position z, ranging trom 0 to 300 m. Change zy in steps or A/100 or smaller. A small interval is necessary to reveal the complete impact of multipath. Use the same values for d, dgr dur, and f you used tor Q1-8 Note that here you are evaluating the amplitude of the received signal (the magnitude of it's phasor, computed using the phasor addition rule) for many values of zy There are two approaches you could take in your code to do this. One is to use a for loop and repeat the computation for a different scalar value of y with each pass through the loop. The second, more elegant approach is to write your dir_delay and refl_delay functions to accept a vector of values in as an input, and return a vector of time delays as an output corresponding to the values of r dt1000; dxr = 80; dyr 600: f-100e6; % frequency T 1/f; % period c = 3e8; % speed of light lamda c/f; % wave length xv = 0: lamda/100: 300; % vehicle position t = 0:lamda/100.3*T; % time samples for three cycles, 100 points per cycle t1 = dir delay (dt, xv); % function dir delay computes delay of direct pat t2-refidelay (dt , dxr , dyr , xv); % computes delay of relected path - %rv cos (2-p1* f* (t-t1)) + cos (2-p1"f* ( t-t2) +pi) ; sum(1*exp (t.tl)1*exp (t.-t2): rv figure plot (xv, rv) title ('Vehicle Signal') xlabel ('vehicle position') ylabel 'amplitude') function tl = dir, delay (dt, xv) % function dir, delay computes delay of direct path nllength (xv) c 3e6; % speed of light tl sqrt ( (nl- dt). "2 ) /c; function t2 = refidelay (dt, dxr, dyr, xv); % computes delay of relected path n-1 : length (xv) ; c 3e6; % speed of light - Lt2 = sqrt( (dxr)."2 + (dyr -dt)."2) + sqrt( (xv-dxr),"2 + (dyr )."2)/c; % distance for both distances over c Now we will study the received signal strength - as measured by the received signal amplitude - as a function of vehicle position. This will reveal the impact of multipath propagation on communication quality. Express the sinusoids due to the direct and refiected paths as phasors in your MATLAB code and use the phasor addition rule to find the amplitude of the received signal. Plot the amplitude as a function of vehicle position z, ranging trom 0 to 300 m. Change zy in steps or A/100 or smaller. A small interval is necessary to reveal the complete impact of multipath. Use the same values for d, dgr dur, and f you used tor Q1-8 Note that here you are evaluating the amplitude of the received signal (the magnitude of it's phasor, computed using the phasor addition rule) for many values of zy There are two approaches you could take in your code to do this. One is to use a for loop and repeat the computation for a different scalar value of y with each pass through the loop. The second, more elegant approach is to write your dir_delay and refl_delay functions to accept a vector of values in as an input, and return a vector of time delays as an output corresponding to the values of r dt1000; dxr = 80; dyr 600: f-100e6; % frequency T 1/f; % period c = 3e8; % speed of light lamda c/f; % wave length xv = 0: lamda/100: 300; % vehicle position t = 0:lamda/100.3*T; % time samples for three cycles, 100 points per cycle t1 = dir delay (dt, xv); % function dir delay computes delay of direct pat t2-refidelay (dt , dxr , dyr , xv); % computes delay of relected path - %rv cos (2-p1* f* (t-t1)) + cos (2-p1"f* ( t-t2) +pi) ; sum(1*exp (t.tl)1*exp (t.-t2): rv figure plot (xv, rv) title ('Vehicle Signal') xlabel ('vehicle position') ylabel 'amplitude') function tl = dir, delay (dt, xv) % function dir, delay computes delay of direct path nllength (xv) c 3e6; % speed of light tl sqrt ( (nl- dt). "2 ) /c; function t2 = refidelay (dt, dxr, dyr, xv); % computes delay of relected path n-1 : length (xv) ; c 3e6; % speed of light - Lt2 = sqrt( (dxr)."2 + (dyr -dt)."2) + sqrt( (xv-dxr),"2 + (dyr )."2)/c; % distance for both distances over c


