

Answered step by step
Verified Expert Solution
Question
1 Approved Answer
Now you want to explore potential portfolio allocations involving a mix of the 2 risky assets rather than just considering each individually. For similicity the

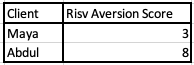
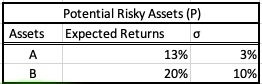


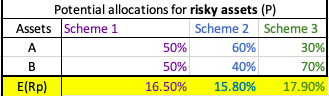

Now you want to explore potential portfolio allocations involving a mix of the 2 risky assets rather than just considering each individually. For similicity the asset and client data is replicated on this tab with the addition of the covariance between risky assets A & B. Risv Aversion Score Client Maya Abdul 3 8 Assets Potential Risky Assets (P) Expected Returns o 13% 3% A B 20% 10% Cov(A,B) 0.21 Evaluate the return of each of the weighting schemes for the risky portion of the portfolio. Calculate the expected return for each of the 3 senarios listed below. Potential allocations for risky assets (P) Assets Scheme 1 Scheme 2 Scheme 3 A 50% 60% 30% B 50% 40% 70% E(Rp) 16.50% 15.80% 17.90% Which has the highest expected return? How would you interpret this in terms of utility
Step by Step Solution
There are 3 Steps involved in it
Step: 1

Get Instant Access to Expert-Tailored Solutions
See step-by-step solutions with expert insights and AI powered tools for academic success
Step: 2

Step: 3
Ace Your Homework with AI
Get the answers you need in no time with our AI-driven, step-by-step assistance
Get Started
Practical financial management
Authors: William r. Lasher
5th Edition
0324422636, 978-0324422634