Answered step by step
Verified Expert Solution
Question
1 Approved Answer
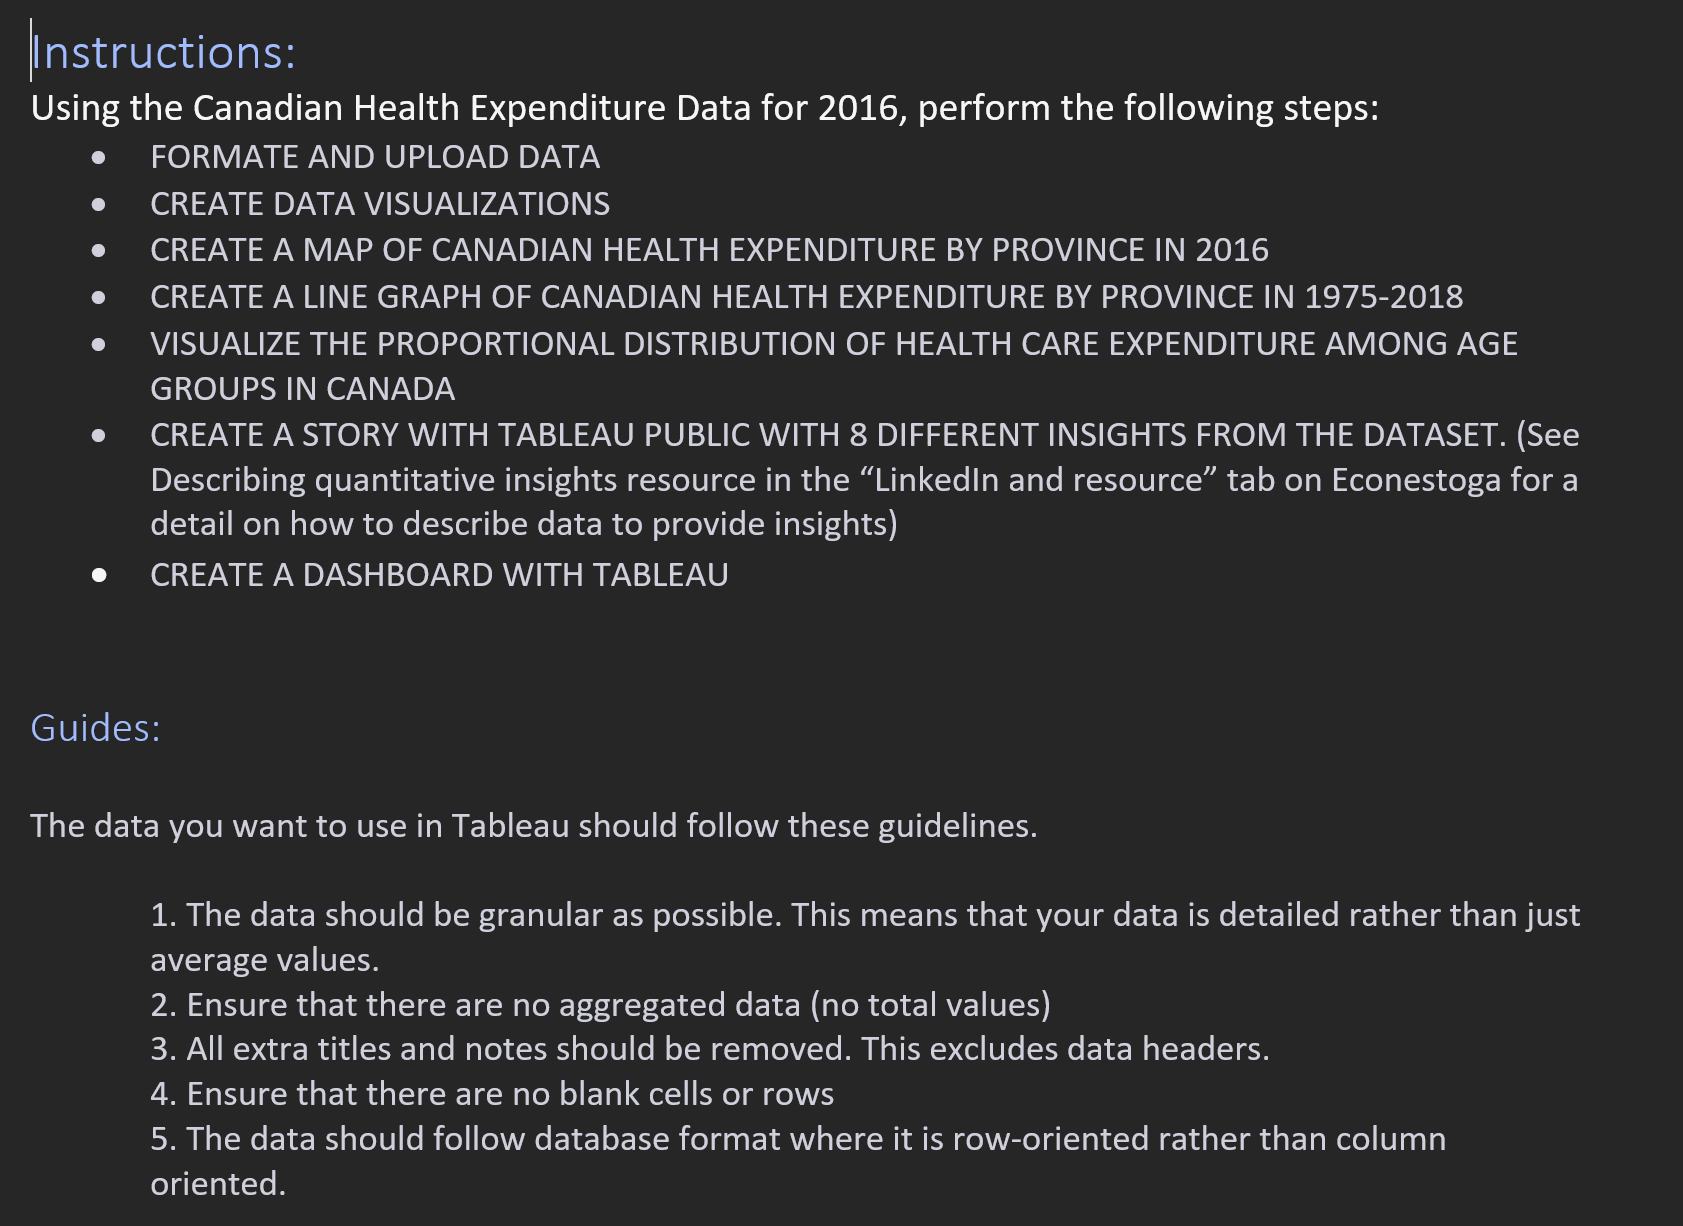
| nstructions: Using the Canadian Health Expenditure Data for 2 0 1 6 , perform the following steps: FORMATE AND UPLOAD DATA CREATE DATA VISUALIZATIONS
nstructions:
Using the Canadian Health Expenditure Data for perform the following steps:
FORMATE AND UPLOAD DATA
CREATE DATA VISUALIZATIONS
CREATE A MAP OF CANADIAN HEALTH EXPENDITURE BY PROVINCE IN
CREATE A LINE GRAPH OF CANADIAN HEALTH EXPENDITURE BY PROVINCE IN
VISUALIZE THE PROPORTIONAL DISTRIBUTION OF HEALTH CARE EXPENDITURE AMONG AGE
GROUPS IN CANADA
CREATE A STORY WITH TABLEAU PUBLIC WITH DIFFERENT INSIGHTS FROM THE DATASET. See
Describing quantitative insights resource in the "Linkedln and resource" tab on Econestoga for a
detail on how to describe data to provide insights
CREATE A DASHBOARD WITH TABLEAU
Guides:
The data you want to use in Tableau should follow these guidelines.
The data should be granular as possible. This means that your data is detailed rather than just
average values.
Ensure that there are no aggregated data no total values
All extra titles and notes should be removed. This excludes data headers.
Ensure that there are no blank cells or rows
The data should follow database format where it is roworiented rather than column
oriented.
Step by Step Solution
There are 3 Steps involved in it
Step: 1

Get Instant Access to Expert-Tailored Solutions
See step-by-step solutions with expert insights and AI powered tools for academic success
Step: 2

Step: 3
Ace Your Homework with AI
Get the answers you need in no time with our AI-driven, step-by-step assistance
Get Started