nswers are entered in the cells with gray backgrounds.\ ells with non-gray backgrounds are protected and cannot be edited.\ 4 .
n asterisk (") will appear to the right of an incorrect entry.\ 5\ 6\ 7\ 1.\ Technology Accessories Inc.\ 8\ Income Statement\ For the Year Ended December 31,
20Y3\ 10\ 11\ Sales\ costs of goods sold\ Gross profit\ \\\\table[[
$18,400,000 
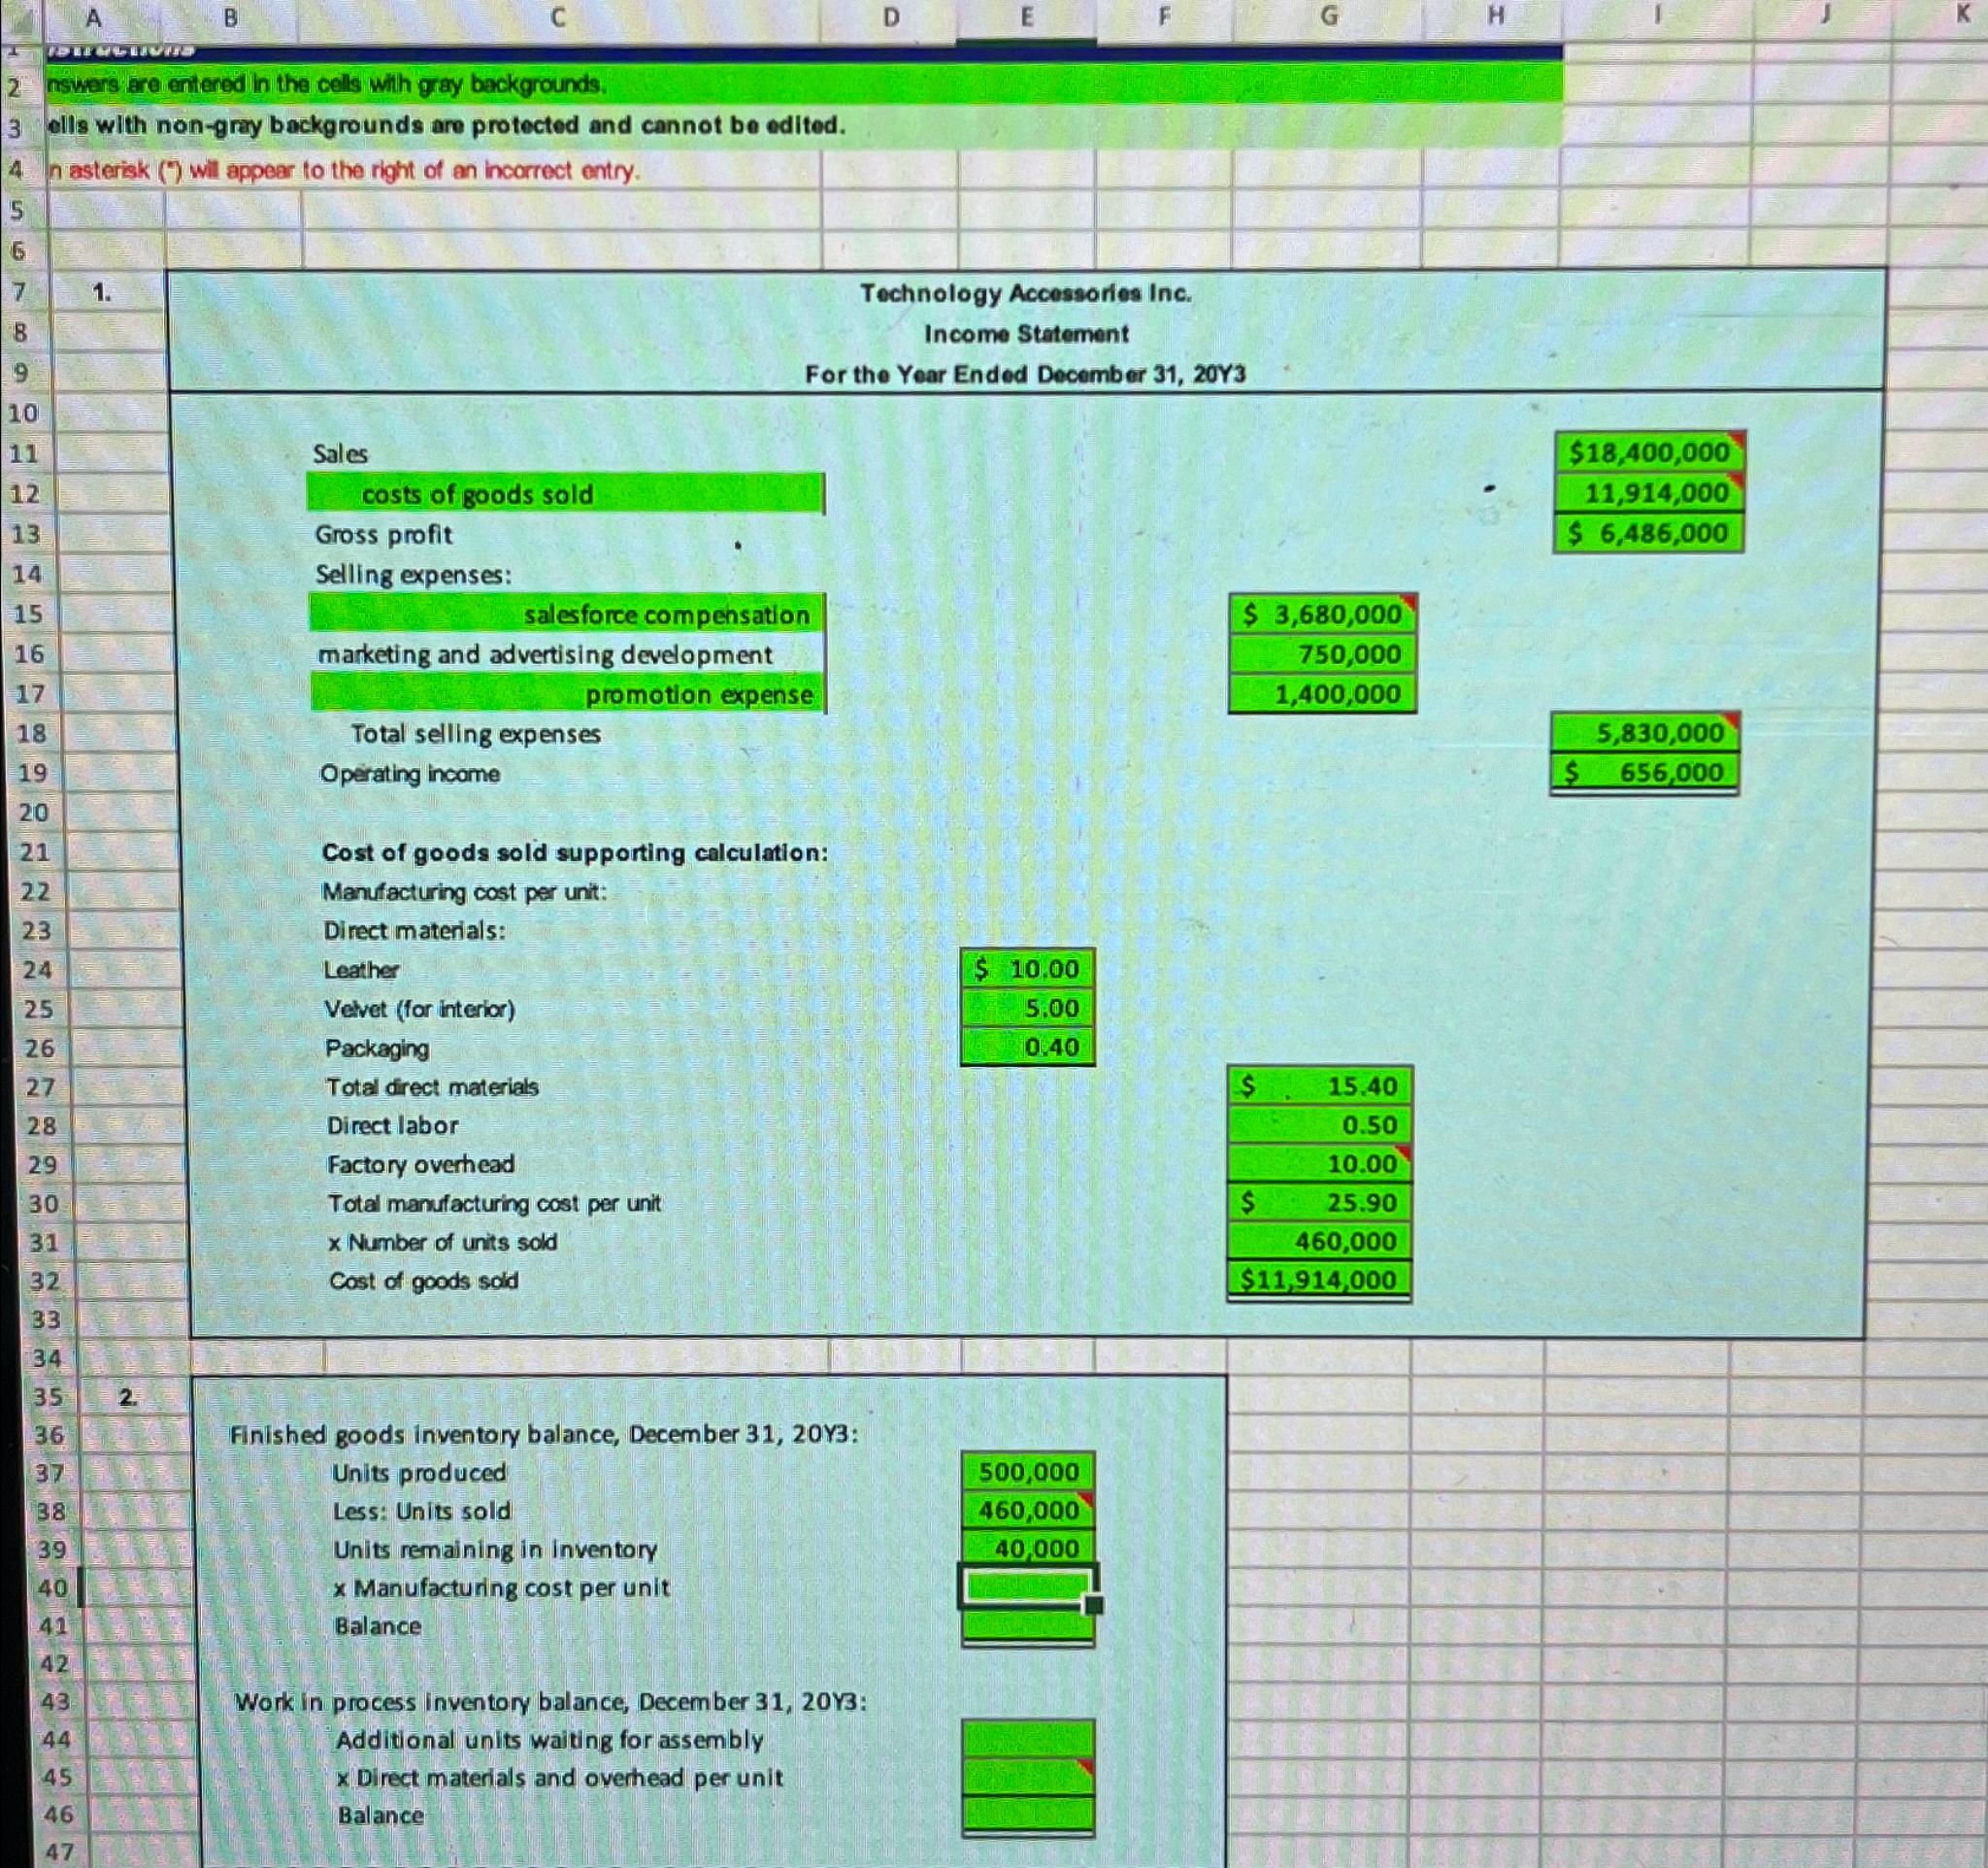
nswers are entered in the cells with gray backgrounds. ells with non-gray backgrounds are protected and cannot be edited. n asterisk (") will appear to the right of an incorrect entry. 1. Technology Accessories Inc. Income Statement For the Year Ended December 31, 20Y3 Sales costs of goods sold Gross profit Selling expenses: \begin{tabular}{|c|c|} \hline salesforce compensation & $3,680,000 \\ \hline marketing and advertising development & 750,000 \\ \hline promotion expense & 1,400,000 \\ \hline \end{tabular} Total selling expenses Operating income Cost of goods sold supporting calculation: Manufacturing cost per unit: Direct materials: Leather Velvet (for interior) Packaging \begin{tabular}{|r|} \hline$10.00 \\ \hline 5.00 \\ \hline 0.40 \\ \hline \end{tabular} Total direct materials Direct labor Factory overhead Total manufacturing cost per unit x Number of units sold Cost of goods sold \begin{tabular}{|r|r|} \hline$ & 15.40 \\ \hline & 0.50 \\ \hline & 10.00 \\ \hline$ & 25.90 \\ \hline & 460,000 \\ \hline$11,914,000 \\ \hline \hline \end{tabular} Finished goods inventory balance, December 31, 20 Y3: Units produced Less: Units sold Units remaining in inventory x Manufacturing cost per unit Balance Work in process inventory balance, December 31, 20Y3: Additional units waiting for assembly x Direct materials and overhead per unit Balance nswers are entered in the cells with gray backgrounds. ells with non-gray backgrounds are protected and cannot be edited. n asterisk (") will appear to the right of an incorrect entry. 1. Technology Accessories Inc. Income Statement For the Year Ended December 31, 20Y3 Sales costs of goods sold Gross profit Selling expenses: \begin{tabular}{|c|c|} \hline salesforce compensation & $3,680,000 \\ \hline marketing and advertising development & 750,000 \\ \hline promotion expense & 1,400,000 \\ \hline \end{tabular} Total selling expenses Operating income Cost of goods sold supporting calculation: Manufacturing cost per unit: Direct materials: Leather Velvet (for interior) Packaging \begin{tabular}{|r|} \hline$10.00 \\ \hline 5.00 \\ \hline 0.40 \\ \hline \end{tabular} Total direct materials Direct labor Factory overhead Total manufacturing cost per unit x Number of units sold Cost of goods sold \begin{tabular}{|r|r|} \hline$ & 15.40 \\ \hline & 0.50 \\ \hline & 10.00 \\ \hline$ & 25.90 \\ \hline & 460,000 \\ \hline$11,914,000 \\ \hline \hline \end{tabular} Finished goods inventory balance, December 31, 20 Y3: Units produced Less: Units sold Units remaining in inventory x Manufacturing cost per unit Balance Work in process inventory balance, December 31, 20Y3: Additional units waiting for assembly x Direct materials and overhead per unit Balance


