

Answered step by step
Verified Expert Solution
Question
1 Approved Answer
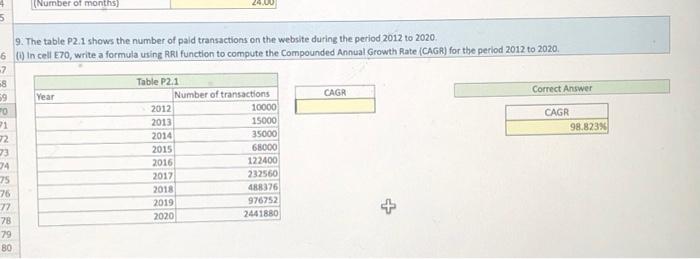
(Number of months) 5 9. The table P2.1 shows the number of paid transactions on the website during the period 2012 to 2020 6. ()
Step by Step Solution
There are 3 Steps involved in it
Step: 1

Get Instant Access to Expert-Tailored Solutions
See step-by-step solutions with expert insights and AI powered tools for academic success
Step: 2

Step: 3
Ace Your Homework with AI
Get the answers you need in no time with our AI-driven, step-by-step assistance
Get Started
Marketing Audit Checklists A Guide To Effective Marketing Resource Realization
Authors: Aubrey Wilson
1st Edition
0077077601, 978-0077077600