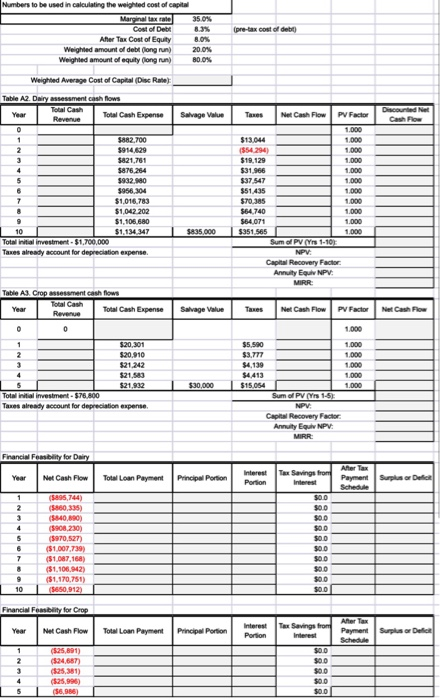
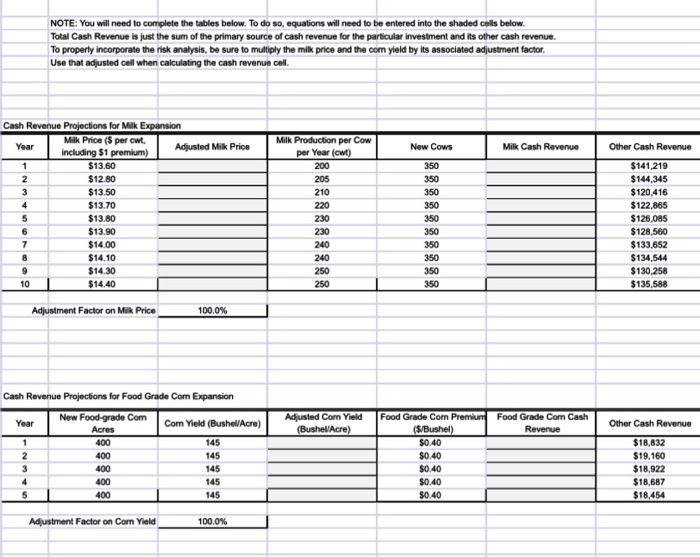
Numbers to be used in calculating the weighted cost of capital Marginal tax rate Cost of Debt Aner Tax Cost of Equity We amount of d ong Weighted amount of equilyong ) 8.0% 20.0% 80.0% Weited Average Cost of Capital Disc Rate Table A2 Dairy m ent shows Total Cash Expense Salvage Value Nu Cash Flow $13.04 $31.SE $37547 $51 435 S882.700 $914629 1821.781 $875.254 $9320 306304 $1.163 51042202 $1.105.680 $1,134 347 Tot investment-$1.700.000 Taxes already account for depreciation expense $54 079 Sum of PV 1-10 Capital Recovery Factor Any Equv NPV: MIRR Tato Al Crop sesent cash flows Total Cash Cash Expense Salvage Value Thes e Cash Flow PV Factor Net Cash Flow $5.590 $20,301 $20.910 321242 $21,583 $21.932 Tota la investment. $76.800 Taxes already account for depreciation expense $30.000 $4413 $15.054 Capital Recovery Factor Annuity EquiNPV MIRR Francis Foy for Dairy Interest Tax Savings from Nel Cash Flow Total Loan Payment Principal Portion Surorul 160.335) ( 23) 070 527) S1 BOT 11 31.10 31.170.751) my interest Tax Savingston Total Loan Payment (25 ) 346 25.381) 125.96 (56 ) NOTE: You will need to complete the tables below. To do so, equations will need to be entered into the shaded cells below Total Cash Revenue is just the sum of the primary source of cash revenue for the particular investment and its other cash revenue. To properly incorporate the risk analysis, be sure to multiply the milk price and the com yield by its associated adjustment factor Use that adjusted cell when calculating the cash revenue cell Year New Cows Milk Cash Revenue WN 350 350 350 Cash Revenue Projections for Milk Expansion Milk Price (s per cut, including $1 premium) Adjusted Milk Price $13.60 $12.80 $13.50 $13.70 $13.80 $13.90 $14.00 $14.10 $14.30 10 $14.40 350 Milk Production per Cow per Year (cwt) 200 205 210 220 230 230 240 240 250 250 350 350 350 350 Other Cash Revenue $141,219 $144,345 $120,416 $122.865 $126,085 $128,560 $133,652 $134,544 $130.258 $135,588 350 350 L Adjustment Factor on Milk Price 100.0% Adjusted Corn Yield (Bushel/Acre) Food Grade Com Cash Revenue Other Cash Revenue Cash Revenue Projections for Food Grade Com Expansion Year New Food-grade Com Corn Yield (BushelAcre) Acres 400 145 400 145 400 145 400 145 145 400 Food Grade Corn Premium (S/Bushel) $0.40 $0.40 $0.40 $0.40 $0.40 $18,832 $19,160 $18,922 $18.687 $18.454 Adjustment Factor on Corn Yield 1000% Numbers to be used in calculating the weighted cost of capital Marginal tax rate Cost of Debt Aner Tax Cost of Equity We amount of d ong Weighted amount of equilyong ) 8.0% 20.0% 80.0% Weited Average Cost of Capital Disc Rate Table A2 Dairy m ent shows Total Cash Expense Salvage Value Nu Cash Flow $13.04 $31.SE $37547 $51 435 S882.700 $914629 1821.781 $875.254 $9320 306304 $1.163 51042202 $1.105.680 $1,134 347 Tot investment-$1.700.000 Taxes already account for depreciation expense $54 079 Sum of PV 1-10 Capital Recovery Factor Any Equv NPV: MIRR Tato Al Crop sesent cash flows Total Cash Cash Expense Salvage Value Thes e Cash Flow PV Factor Net Cash Flow $5.590 $20,301 $20.910 321242 $21,583 $21.932 Tota la investment. $76.800 Taxes already account for depreciation expense $30.000 $4413 $15.054 Capital Recovery Factor Annuity EquiNPV MIRR Francis Foy for Dairy Interest Tax Savings from Nel Cash Flow Total Loan Payment Principal Portion Surorul 160.335) ( 23) 070 527) S1 BOT 11 31.10 31.170.751) my interest Tax Savingston Total Loan Payment (25 ) 346 25.381) 125.96 (56 ) NOTE: You will need to complete the tables below. To do so, equations will need to be entered into the shaded cells below Total Cash Revenue is just the sum of the primary source of cash revenue for the particular investment and its other cash revenue. To properly incorporate the risk analysis, be sure to multiply the milk price and the com yield by its associated adjustment factor Use that adjusted cell when calculating the cash revenue cell Year New Cows Milk Cash Revenue WN 350 350 350 Cash Revenue Projections for Milk Expansion Milk Price (s per cut, including $1 premium) Adjusted Milk Price $13.60 $12.80 $13.50 $13.70 $13.80 $13.90 $14.00 $14.10 $14.30 10 $14.40 350 Milk Production per Cow per Year (cwt) 200 205 210 220 230 230 240 240 250 250 350 350 350 350 Other Cash Revenue $141,219 $144,345 $120,416 $122.865 $126,085 $128,560 $133,652 $134,544 $130.258 $135,588 350 350 L Adjustment Factor on Milk Price 100.0% Adjusted Corn Yield (Bushel/Acre) Food Grade Com Cash Revenue Other Cash Revenue Cash Revenue Projections for Food Grade Com Expansion Year New Food-grade Com Corn Yield (BushelAcre) Acres 400 145 400 145 400 145 400 145 145 400 Food Grade Corn Premium (S/Bushel) $0.40 $0.40 $0.40 $0.40 $0.40 $18,832 $19,160 $18,922 $18.687 $18.454 Adjustment Factor on Corn Yield 1000%


