Answered step by step
Verified Expert Solution
Question
1 Approved Answer
NW W 40- 30 - married wage Married 20- Single 10- 0- M M sex Consider this bar graph of the CPS85 data in the
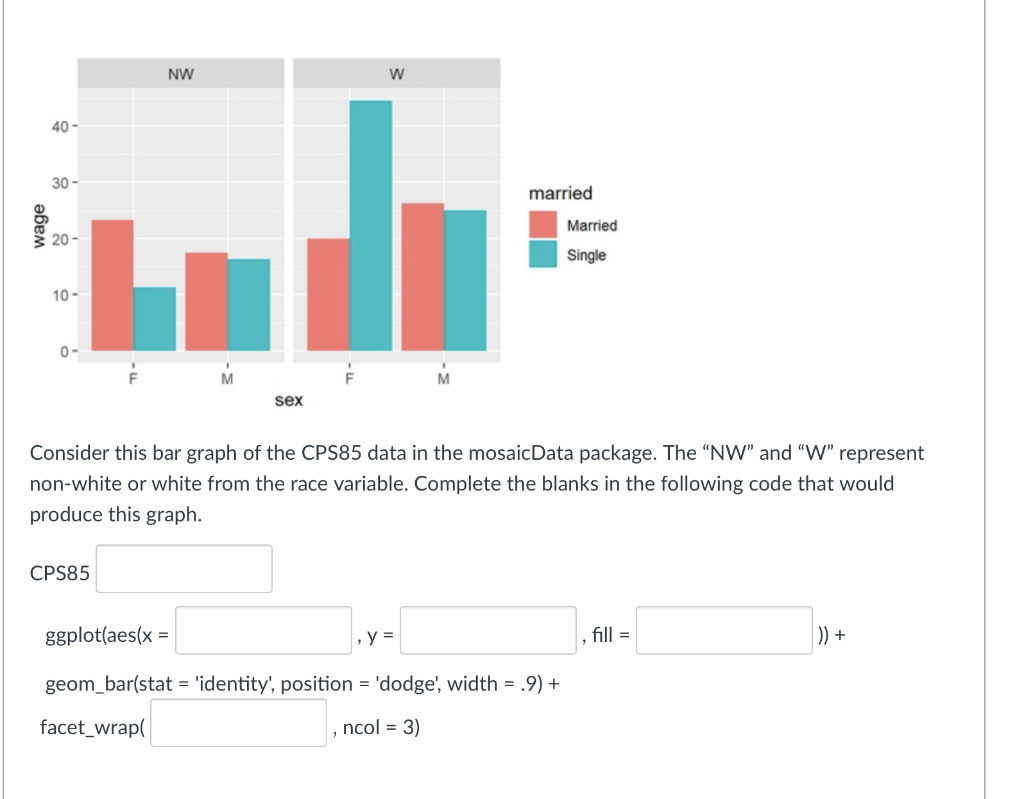
NW W 40- 30 - married wage Married 20- Single 10- 0- M M sex Consider this bar graph of the CPS85 data in the mosaicData package. The NW and W represent non-white or white from the race variable. Complete the blanks in the following code that would produce this graph. CPS85 ggplot(aes(x = y = fill = )) + geom_bar(stat = 'identity', position = 'dodge', width = .9) + facet_wrap ncol = 3) NW W 40- 30 - married wage Married 20- Single 10- 0- M M sex Consider this bar graph of the CPS85 data in the mosaicData package. The NW and W represent non-white or white from the race variable. Complete the blanks in the following code that would produce this graph. CPS85 ggplot(aes(x = y = fill = )) + geom_bar(stat = 'identity', position = 'dodge', width = .9) + facet_wrap ncol = 3)
Step by Step Solution
There are 3 Steps involved in it
Step: 1
Get Instant Access to Expert-Tailored Solutions
See step-by-step solutions with expert insights and AI powered tools for academic success
Step: 2
Step: 3
Ace Your Homework with AI
Get the answers you need in no time with our AI-driven, step-by-step assistance
Get Started