

Answered step by step
Verified Expert Solution
Question
1 Approved Answer
NYC Flights We will use some flight data in this problem. To access it , remember to load the tidyverse, mdsr , and nycflights 1
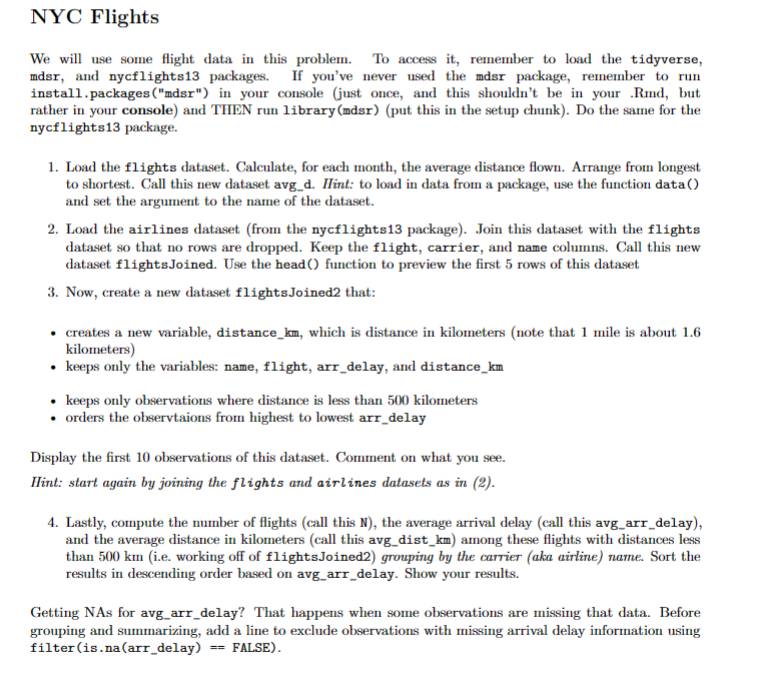
NYC Flights
We will use some flight data in this problem. To access it remember to load the tidyverse,
mdsr and nycflights packages. If you've never used the mdsr package, remember to run
install.packagesmdsr in your console just once, and this shouldn't be in your Rmd but
rather in your console and THEN run librarymdsrput this in the setup chunk Do the same for the
nycflights package.
Load the flights dataset. Calculate, for each month, the average distance flown. Arrange from longest
to shortest. Call this new dataset avgd IInt: to load in data from a package, use the function data
and set the argument to the name of the dataset.
Load the airlines dataset from the nycflights package Join this dataset with the flights
dataset so that no rows are dropped. Keep the flight, carrier, and name columns. Call this new
dataset flightsJoined. Use the head function to preview the first rows of this dataset
Now, create a new dataset flightsJoined that:
creates a new variable, distance which is distance in kilometers note that mile is about
kilometers
keeps only the variables: name, flight, arrdelay, and distancekm
keeps only observations where distance is less than kilometers
orders the observtaions from highest to lowest arrdelay
Display the first observations of this dataset. Comment on what you see.
Hint: start again by joining the flights and airlines datasets as in
Lastly, compute the number of flights call this N the average arrival delay call this avgarrdelay
and the average distance in kilometers call this avgdistkm among these flights with distances less
than ie working off of flightsJoined grouping by the carrier aka airline name. Sort the
results in descending order based on avgarrdelay. Show your results.
Getting NAs for avgarrdelay? That happens when some observations are missing that data. Before
grouping and summarizing, add a line to exclude observations with missing arrival delay information using
filter
isnaarrdelay FALSE
Step by Step Solution
There are 3 Steps involved in it
Step: 1

Get Instant Access to Expert-Tailored Solutions
See step-by-step solutions with expert insights and AI powered tools for academic success
Step: 2

Step: 3
Ace Your Homework with AI
Get the answers you need in no time with our AI-driven, step-by-step assistance
Get Started
Database Programming Languages 12th International Symposium Dbpl 2009 Lyon France August 2009 Proceedings Lncs 5708
Authors: Philippa Gardner ,Floris Geerts
2009th Edition
3642037925, 978-3642037924