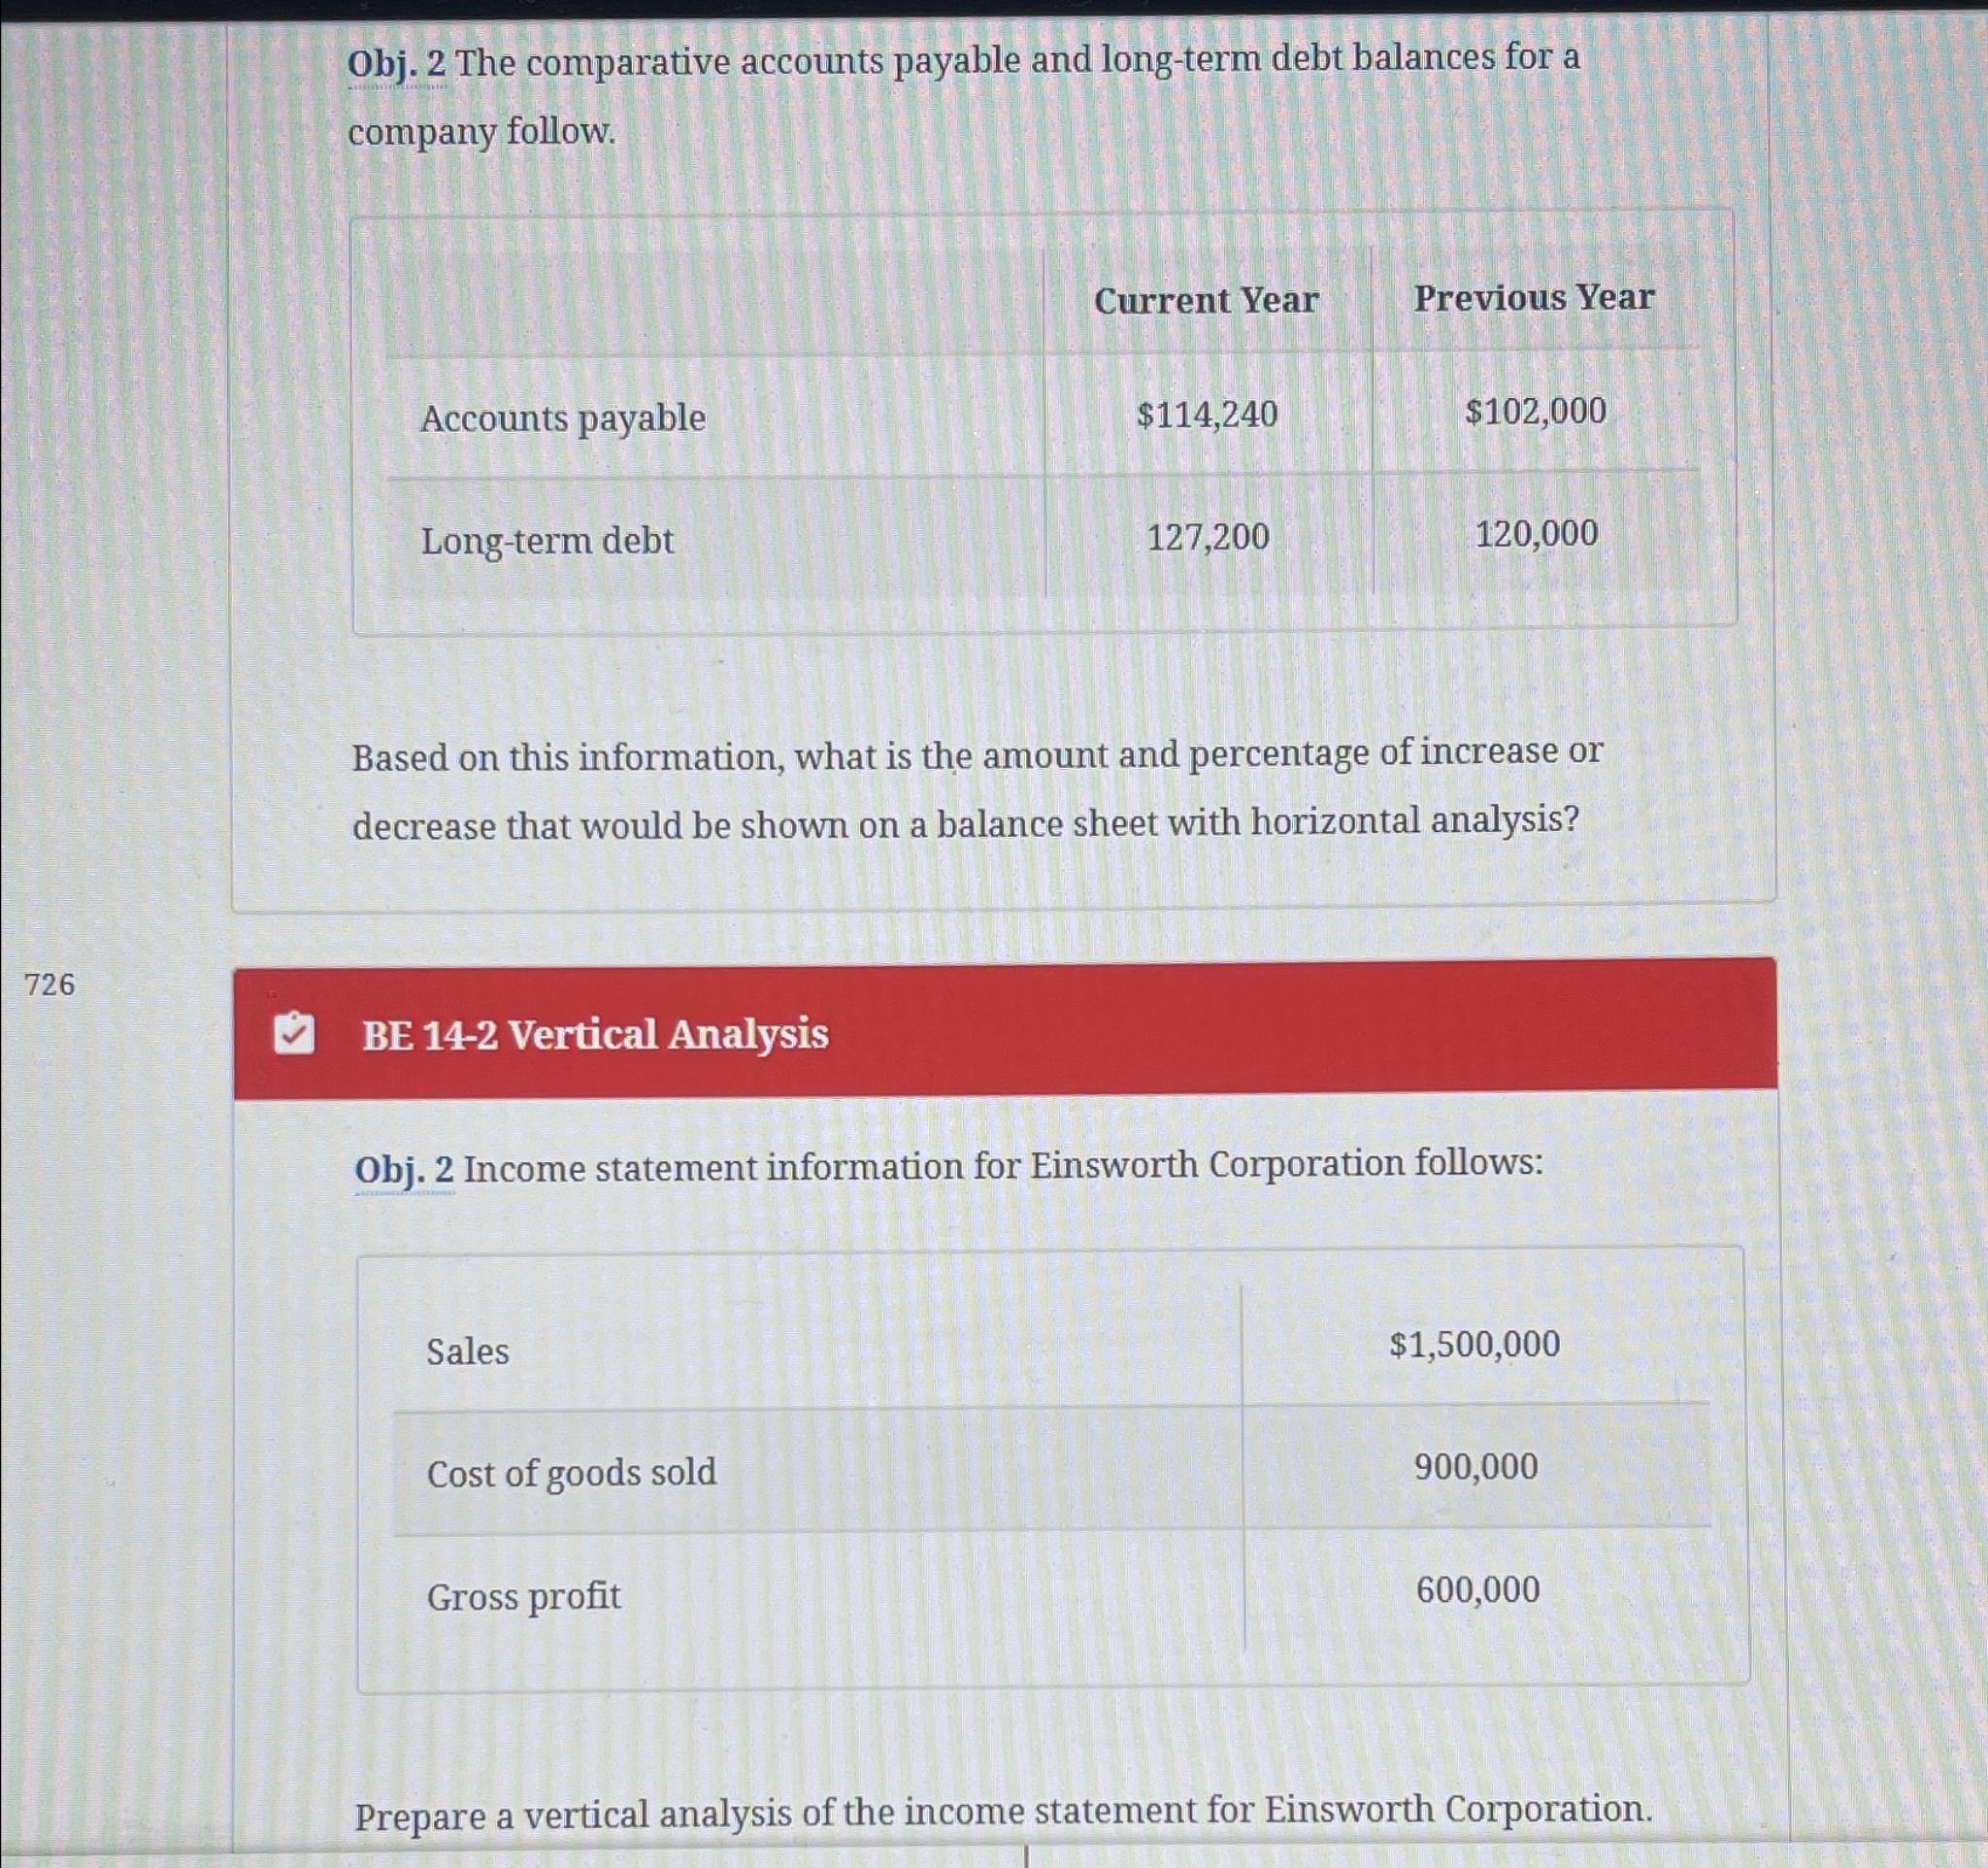
Obj. 2 The comparative accounts payable and long-term debt balances for a company follow. Accounts payable Long-term debt Current Year Previous Year $114,240 $102,000

Obj. 2 The comparative accounts payable and long-term debt balances for a company follow. Accounts payable Long-term debt Current Year Previous Year $114,240 $102,000 127,200 120,000 Based on this information, what is the amount and percentage of increase or decrease that would be shown on a balance sheet with horizontal analysis? 726 BE 14-2 Vertical Analysis Obj. 2 Income statement information for Einsworth Corporation follows: Sales Cost of goods sold Gross profit $1,500,000 900,000 600,000 Prepare a vertical analysis of the income statement for Einsworth Corporation.
Step by Step Solution
There are 3 Steps involved in it
Step: 1
Certainlylets analyze the image you provided Horizontal Analysis Horizontal analysis compares financial data from different periods to assess changes over timeIn this casewell compare the current years accounts payable and longterm debt balances to the previous years balances Calculations Accounts Payable Amount Change114240 102000 12240 increase Percentage Change12240 102000 100 1200 increase LongTerm Debt Amount Change127200 120000 7200 increase Percentage Change7200 120000 100 600 increase Summary On a balance sheet with horizontal analysisyou would show Accounts Payable Increased by 12240 1200 LongTerm Debt Increased by 7200 600 Interpretation Both accounts payable and longterm debt increased from the previous year to the current yearThe increase in accounts payable was more significant in both amount and percentage terms Note The image also includes information for vertical analysiswhich is a different type of financial analysis Without additional context its difficult to determine the reasons behind the increases in accounts payable and longterm debt Further analysis of the companys operations and financial performance would be necessary to understand the implications of these changes Understanding the Explanation Horizontal Analysis Horizontal analysis is a financial analysis technique that compares financial data from different periods to identify changes over time In this case were looking at two specific accounts Accounts Payable and LongTerm Debt How the Analysis Was Done Data Collection The current years and previous years figures for Accounts Payable and LongTerm Debt were gathered Calculation of Changes The difference between the current years and previous years figures for each account was calculated This gives us the amount change The percentage change was calculated by dividing the amount change by the previous years figure and multiplying by 100 Interpretation of Results The calculated changes were analyzed to understand the direction increase or decrease and magnitude of the changes for both accounts What the Results Mean Accounts Payable Increased This means the company owes more to its suppliers at the end of the current year ...
See step-by-step solutions with expert insights and AI powered tools for academic success
Step: 2

Step: 3

Ace Your Homework with AI
Get the answers you need in no time with our AI-driven, step-by-step assistance
Get Started


