Question
# Objective: In this assignment we aim to use Python language to draw squared spiral forms using color data saved in text files. An example

 #
#

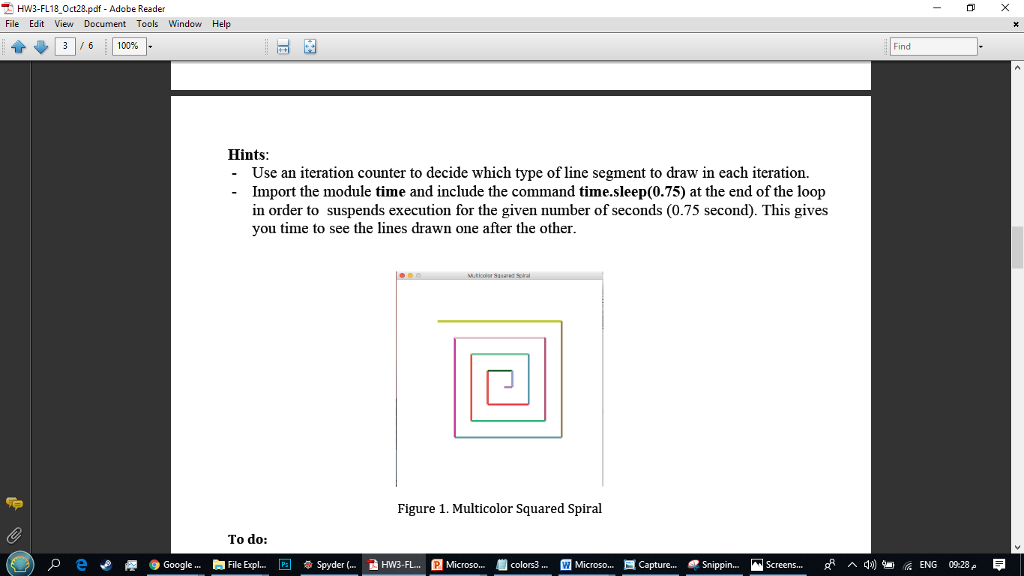
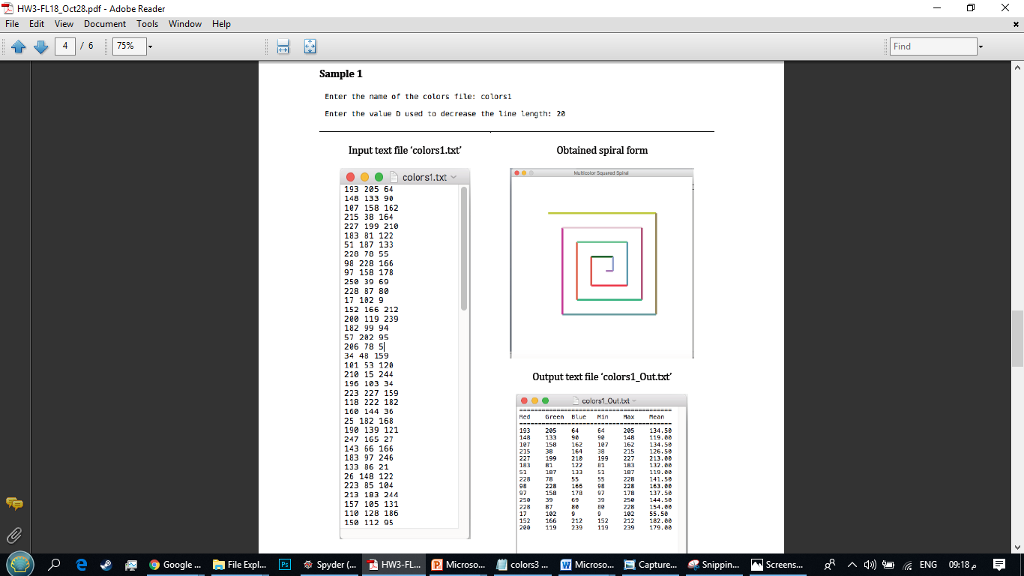
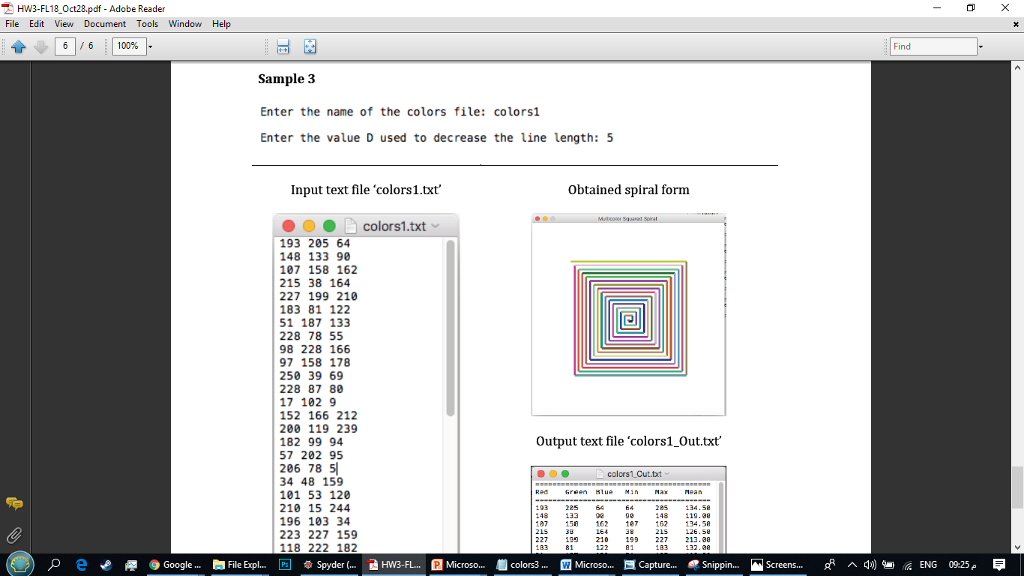
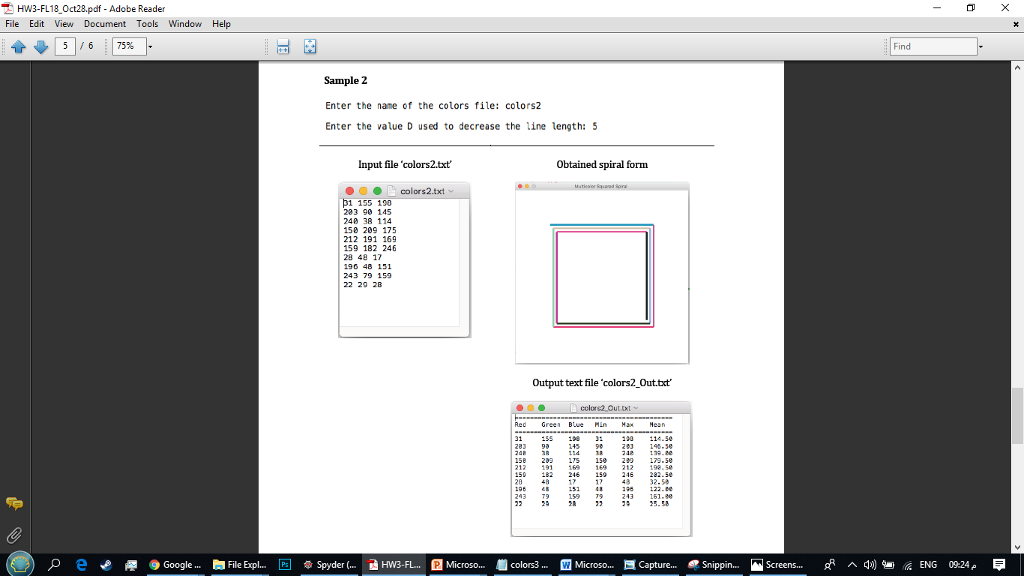
Objective: In this assignment we aim to use Python language to draw squared spiral forms using color data saved in text files. An example of spiral form is shown in Figure 1. The program input is a text file, which contains n lines. Each line contains three integer numbers representing the Red, Green and Blue values of the color used to draw a line segment (see Figures 2, 3 and 4). Three text files are provided: colors1.txt, colors2.txt and colors3.txt.
The program uses a loop where, in each iteration, it reads from the input text file three principal color components, Red, Green and Blue and then draws one of the following four line segments: 1. Horizontal line segment from left to right. 2. Vertical line segment from up to down. 3. Horizontal line segment from right to left. 4. Vertical line segment from down to up.
It is worth to note that the line segments are drawn iteratively in the order mentioned above, and always the next line starts from the end of the previous line as described in the following algorithm:
Algorithm:
T: constant, e.g., T = 2
D: value given by the user, e.g., D = 10
x0 = 100 # initial coordinates x0, y0
y0 = 100 newLineLength = 300 # initial line length
i = 1 # loop counter
While newLineLength is not smaller than T and the end of the input file is not reached
read the (r,g,b) colors from the input file
if. # to be defined by the student
- x1 = x0 - y1 = y0
- x2 = x1 + newLineLength
- y2 = y1
- draw the 1st type of line segment from (x1, y1) to (x2, y2).
if.. # to be defined by the student
- x1 = x2
- y1 = y2
- x2 = x1
- y2 = y1 + newLineLength
- draw the 2nd type of line segment from (x1, y1) to (x2, y2).
if # to be defined by the student
- x1 = x2
- y1 = y2
- x2 = x1 newLineLength
- y2 = y1
- draw the 3rd type of line segment from (x1, y1) to (x2, y2).
if . # to be defined by the student
- x1 = x2
- y1 = y2
- x2 = x1 - y2 = y1 newLineLength
- draw the 4th type of line segment from (x1, y1) to (x2, y2).
Decrease the line length by D to get a new length. - newLineLength = newLineLength - D
x0 = x2 # Initial coordinates of the next horizontal from left to right y0 = y2
Write the current red, green, blue, min, and max values in the output file.
i = i+1 time.sleep(0.75) # import the library time
EndWhile
#Hints
: - Use an iteration counter to decide which type of line segment to draw in each iteration. - Import the module time and include the command time.sleep(0.75) at
he end of the loop in order to suspends execution for the given number of seconds (0.75 second). This gives you time to see the lines drawn one after the other.
#To do: 1.
Write a Python Program that reads form an input text file (e.g. colors1.txt) the colour components, Red, Green and Blue and then draw the squared spiral form in question, as described in the objective section. The spiral forms should look like the ones shown in Figures 1, 2, 3 and 4. 2. Create a new text file (for example, 'colors1_Out.txt') containing the following data values in each of its lines: Red: the red colour component value. Green: the green colour component value. Blue: the blue colour component value. Min: the minimum value among Red, Green and Blue. Max: the maximum value among Red, Green and Blue. Mean: the average value of red, green and blue values.
colors1.txt (R, G, B)
193 205 64 148 133 90
107 158 162
215 38 164
227 199 210
183 81 122 51 187 133
228 78 55
98 228 166
97 158 178
250 39 69
228 87 80
17 102 9
152 166 212
200 119 239
182 99 94
57 202 95
206 78 5
34 48 159
101 53 120
210 15 244
196 103 34
223 227 159
118 222 182
160 144 36
25 182 168
190 139 121
247 165 27
143 66 166
183 97 246
133 86 21
26 148 122
223 85 104
213 183 244
157 105 131
110 128 186
150 112 95
69 140 32
177 96 203
64 86 124
40 127 199
238 160 144
175 40 161 235 77 193
112 93 154
37 3 114
42 146 178
84 184 130
179 183 165
55 136 201
154 71 28
28 30 213
124 193 148
123 87 172
47 250 193
35 157 193
205 114 100
18 107 150
41 22 54
174 72 79
244 92 68
77 238 87
255 239 49
74 71 73
199 131 236
213 23 236
249 154 214
230 171 199
17 121 93
191 115 51
39 23 53
230 150 37
230 138 148
60 7 162 183 9 96
116 208 19
141 212 142
154 221 198
56 148 241
226 157 45
38 35 203
72 37 153
147 197 203
189 229 46
26 96 108
84 240 79
137 116 86
149 51 162
78 158 76
146 60 87
185 61 124
81 247 152
5 142 224
87 210 106
122 210 7
38 95 156
151 4 45 16 233 246
201 197 27
153 247 69
#color2.txt
31 155 198
203 90 145
240 38 114
150 209 175
212 191 169 159 182 246
28 48 17
196 48 151
243 79 159
22 29 28
color3.txt
22 135 217
202 60 192
109 186 10
198 81 117
234 151 172
65 69 162
61 139 198
201 120 20
135 174 169
170 40 27
187 255 43
147 30 141
109 69 11
109 67 31
32 165 197
10 52 231
162 213 157
68 138 137
131 68 195
236 84 108
207 143 56
110 107 242
146 250 24
234 253 185
106 59 49
161 133 79
40 74 88
87 153 88
129 76 152
95 145 54
65 231 32
32 28 204
44 237 226
146 189 135
167 36 29
105 170 50
152 197 80
210 77 162
169 208 226
59 162 59
170 25 49
2 81 36
51 230 31
4 53 41
14 18 32
161 123 167
233 5 126
29 71 81
186 206 241
199 234 92
-FL18-Oct28.pdf-Adobe R File Edit View Document Tools Window Help Find Hints: - Use an iteration counter to decide which type of line segment to draw in each iteration. Import the module time and include the command time.sleep(0.75) at the end of the loop in order to suspends execution for the given number of seconds (0.75 second). This gives you time to see the lines drawn one after the other. Figure 1. Multicolor Squared Spiral To do: e e Google B, File Expl Spyder ( HW3-FL .. @ Microso colors3 M Microso Capture Snippin ^q)- ENG 09:28 Ps eens.. -FL18-Oct28.pdf-Adobe R File Edit View Document Tools Window Help Find Hints: - Use an iteration counter to decide which type of line segment to draw in each iteration. Import the module time and include the command time.sleep(0.75) at the end of the loop in order to suspends execution for the given number of seconds (0.75 second). This gives you time to see the lines drawn one after the other. Figure 1. Multicolor Squared Spiral To do: e e Google B, File Expl Spyder ( HW3-FL .. @ Microso colors3 M Microso Capture Snippin ^q)- ENG 09:28 Ps eensStep by Step Solution
There are 3 Steps involved in it
Step: 1

Get Instant Access to Expert-Tailored Solutions
See step-by-step solutions with expert insights and AI powered tools for academic success
Step: 2

Step: 3

Ace Your Homework with AI
Get the answers you need in no time with our AI-driven, step-by-step assistance
Get Started


