Question
Objective: To determine the position and jerk versus time graphs of the Snap-the-whip amusement park ride using the velocity and acceleration analysis from Lab 3.
Objective: To determine the position and jerk versus time graphs of the Snap-the-whip amusement park ride using the velocity and acceleration analysis from Lab 3.
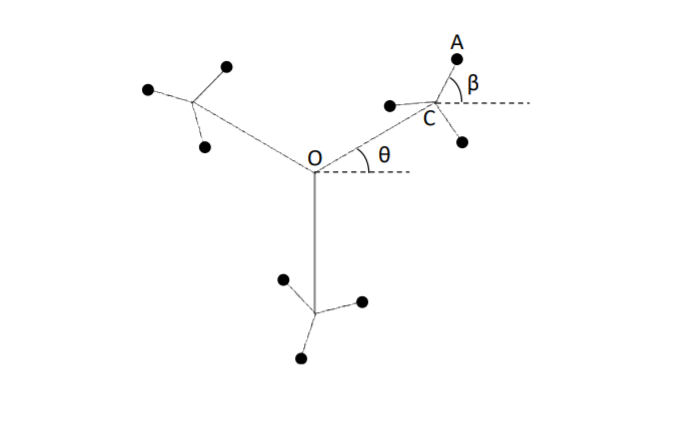
To be submitted: Please submit youranswers to the Action Items using the Lab 4 Answers word document found on Blackboard. Write a script for the following scenario: In Lab 3, velocity and acceleration versus time data were generated for the snap-the-whip ride shown below. An additional two factors that should be considered when designing the ride are position and jerk (the derivative of acceleration with respect to time). The position data will be important for safety and jerk is a good way to quantify passenger comfort.
Using the code and data generated in Lab 3, create the following:
1. The position versus time graphs (X and Y components). Please use the Trapezoid Rule.
2. Four position versus time graphs generated using trapezoids of different widths. Plot all four graphs in a single figure (hint: use the subplot function). Discuss the effect of varying this width.
3. The jerk versus time graph (X and Y components).
Action Item 1: Copy your script, graphs, and discussion into the Lab 4 Answer document. Please comment your code appropriately.
Action Item 2: Discuss the results of the position, velocity, acceleration, and jerk versus time graphs created in Labs 3 and 4 in terms of inflection points. How do these points affect the experience of the rider?

OC length is 4.5 and AC length is 1.5. theta is from 0 to 2 pi.
Step by Step Solution
There are 3 Steps involved in it
Step: 1

Get Instant Access to Expert-Tailored Solutions
See step-by-step solutions with expert insights and AI powered tools for academic success
Step: 2

Step: 3

Ace Your Homework with AI
Get the answers you need in no time with our AI-driven, step-by-step assistance
Get Started


