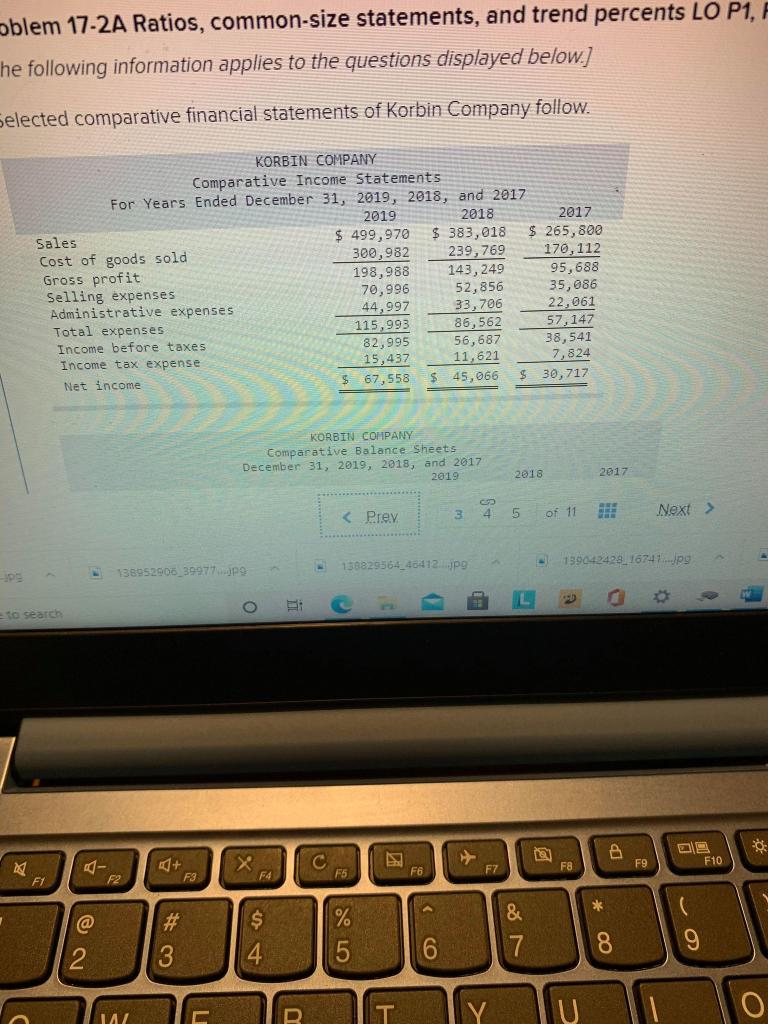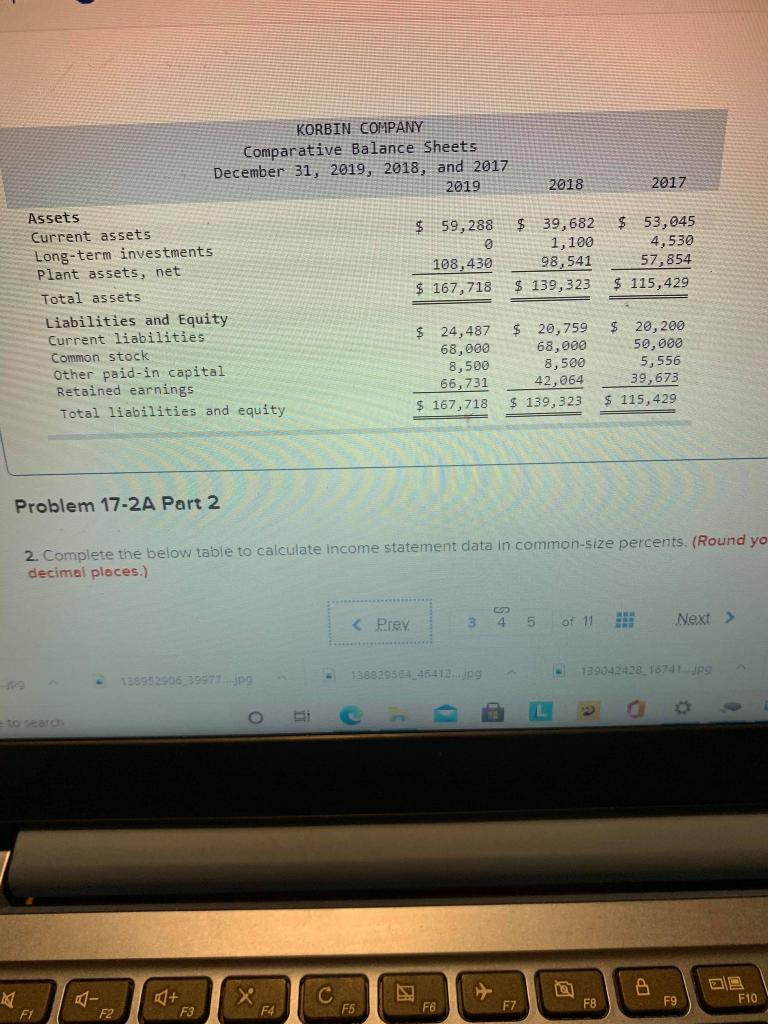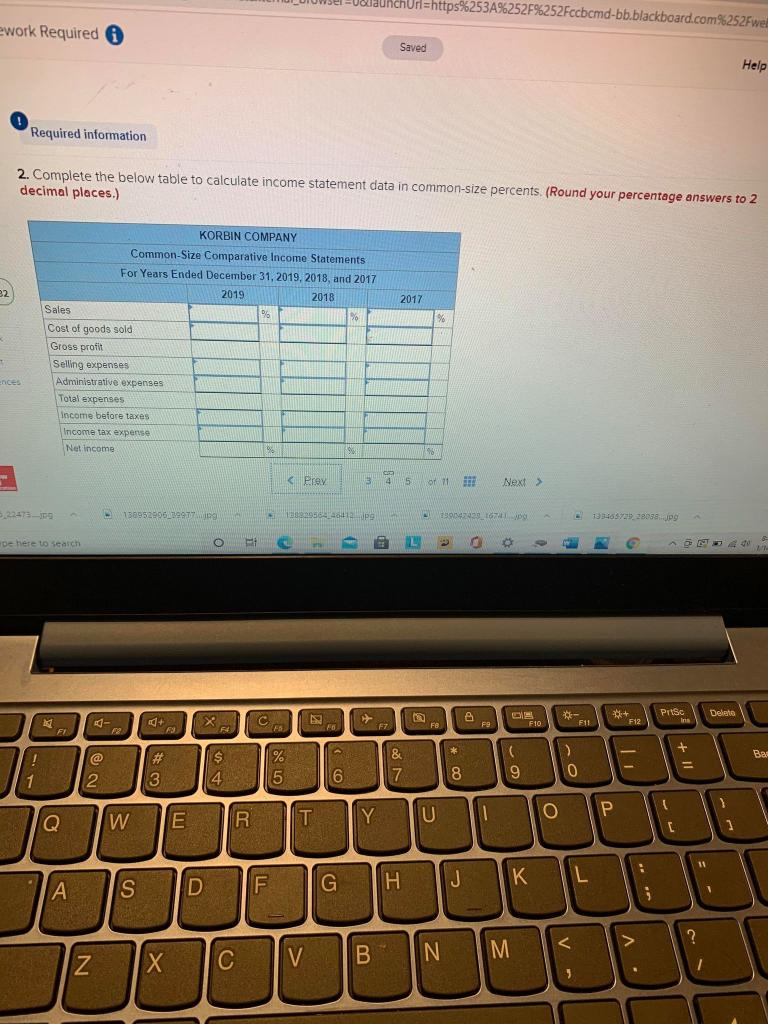


oblem 17-2A Ratios, common-size statements, and trend percents LO P1, F he following information applies to the questions displayed below.] Selected comparative financial statements of Korbin Company follow. KORBIN COMPANY Comparative Income Statements For Years Ended December 31, 2019, 2018, and 2017 2019 2018 2017 Sales $ 499,970 $ 383,018 $ 265,800 Cost of goods sold 300,982 239,769 170,112 Gross profit 198,988 143,249 95,688 Selling expenses 70,996 52,856 35,086 Administrative expenses 44,997 33,706 22,061 Total expenses 115,993 86,562 57,147 Income before taxes 82,995 56,687 38,541 Income tax expense 15,437 11,621 7,824 Net income $ 67,558 $ 45,066 $ 30,717 KORBIN COMPANY Comparative Balance Sheets December 31, 2019, 2018, and 2017 2019 2018 2017 138829564_48412.jpg 139042428_16747.jpg 138952906_39977.jpg DE L to search D ta + C F10 F9 F8 ng F1 F5 F6 F2 @ # % 5 & 7 * 00 9 2 3 6 TA M KORBIN COMPANY Comparative Balance Sheets December 31, 2019, 2018, and 2017 2019 2018 2017 Assets Current assets $ 59,288 $ 39,682 $ 53, 045 Long-term investments 0 1,100 4,530 Plant assets, net 108,430 98,541 57,854 Total assets $ 167,718 $ 139,323 $ 115,429 Liabilities and Equity Current liabilities $ 24,487 $ 20,759 $ 20, 200 Common stock 68,000 68,000 50,000 Other paid-in capital 8,500 8,500 5,556 Retained earnings 66,731 42,064 39,673 Total liabilities and equity $ 167, 718 $ 139,323 $ 115,429 Problem 17-2A Part 2 2. Complete the below table to calculate income statement data in common-size percents. (Round yo decimal places.) 13882958446-412.jpg 138952906,39977.jpg 139042428_16741.jpg to reach A C X F4 My F1 F10 F9 F6 F8 F3 F7 F5 F2 UnchUrl=https%253A%252F%252Fccbcmd-bb blackboard.com%252Fwel ework Required 0 Saved Help Required information 2. Complete the below table to calculate income statement data in common-size percents (Round your percentage answers to 2 decimal places.) KORBIN COMPANY Common-Size Comparative Income Statements For Years Ended December 31, 2019, 2018, and 2017 2019 2018 82 2017 DO 120 % 1 ences Sales Cost of goods sold Gross profit Selling expenses Administrative expenses Total expenses income before taxes Income tax expense Net Income 9 194 224739 13095206999 12295629 59042316 1334637338038.JPG De here to search PISC + F12 Delato - A F7 FB FO F9 F10 F11 FI + Bad ! @ 2 # 3 $ % 4 5 16 & 7 ) 0 8 9 1 I W E Q R U T 1 Y 1 : = S D K L G J F H . 1 ?


