Question
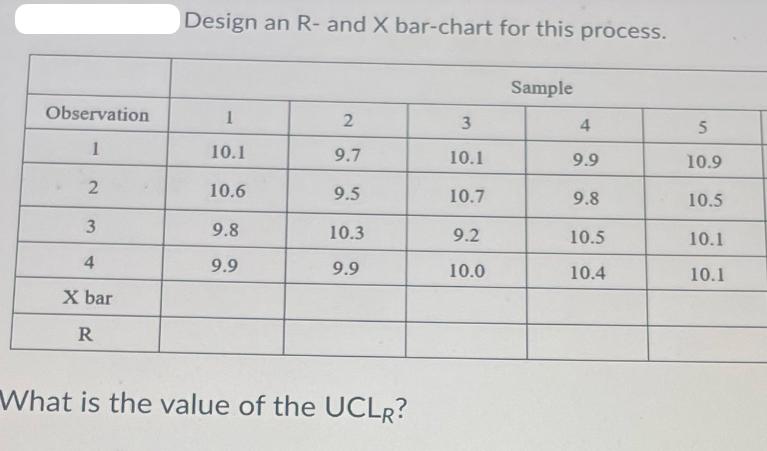
Observation 1 2 3 4 X bar R Design an R- and X bar-chart for this process. 1 10.1 10.6 9.8 9.9 2 9.7

Observation 1 2 3 4 X bar R Design an R- and X bar-chart for this process. 1 10.1 10.6 9.8 9.9 2 9.7 9.5 10.3 9.9 What is the value of the UCLR? 3 10.1 10.7 9.2 10.0 Sample 4 9.9 9.8 10.5 10.4 5 10.9 10.5 10.1 10.1
Step by Step Solution
There are 3 Steps involved in it
Step: 1
Absolutely lets calculate the Upper Control Limit UCLr step by step for the Rbar chart using the pro...
Get Instant Access to Expert-Tailored Solutions
See step-by-step solutions with expert insights and AI powered tools for academic success
Step: 2

Step: 3

Ace Your Homework with AI
Get the answers you need in no time with our AI-driven, step-by-step assistance
Get StartedRecommended Textbook for
Fundamentals Of Biostatistics
Authors: Bernard Rosner
8th Edition
130526892X, 978-1305465510, 1305465512, 978-1305268920
Students also viewed these General Management questions
Question
Answered: 1 week ago
Question
Answered: 1 week ago
Question
Answered: 1 week ago
Question
Answered: 1 week ago
Question
Answered: 1 week ago
Question
Answered: 1 week ago
Question
Answered: 1 week ago
Question
Answered: 1 week ago
Question
Answered: 1 week ago
Question
Answered: 1 week ago
Question
Answered: 1 week ago
Question
Answered: 1 week ago
Question
Answered: 1 week ago
Question
Answered: 1 week ago
Question
Answered: 1 week ago
Question
Answered: 1 week ago
Question
Answered: 1 week ago
Question
Answered: 1 week ago
Question
Answered: 1 week ago
View Answer in SolutionInn App


