

Answered step by step
Verified Expert Solution
Question
1 Approved Answer
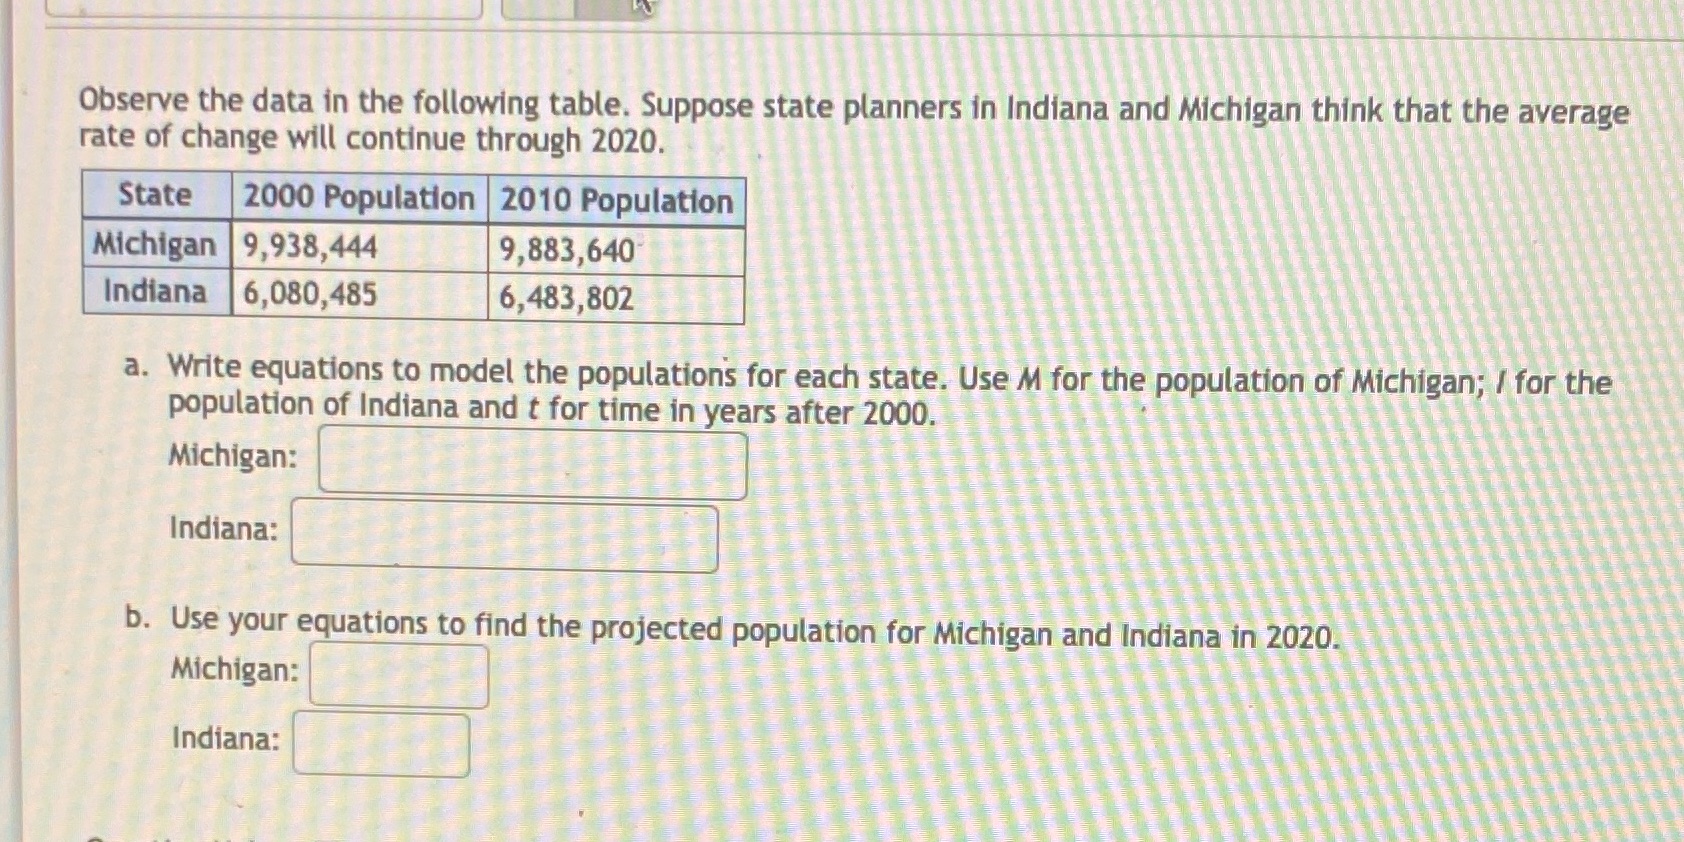
Observe the data in the following table. Suppose state planners in Indiana and Michigan think that the average rate of change will continue through 2020.
Step by Step Solution
There are 3 Steps involved in it
Step: 1

Get Instant Access to Expert-Tailored Solutions
See step-by-step solutions with expert insights and AI powered tools for academic success
Step: 2

Step: 3
Ace Your Homework with AI
Get the answers you need in no time with our AI-driven, step-by-step assistance
Get Started
Why Knot An Introduction To The Mathematical Theory Of Knots With Tangle
Authors: Colin Adams
1st Edition
0470413492, 978-0470413494