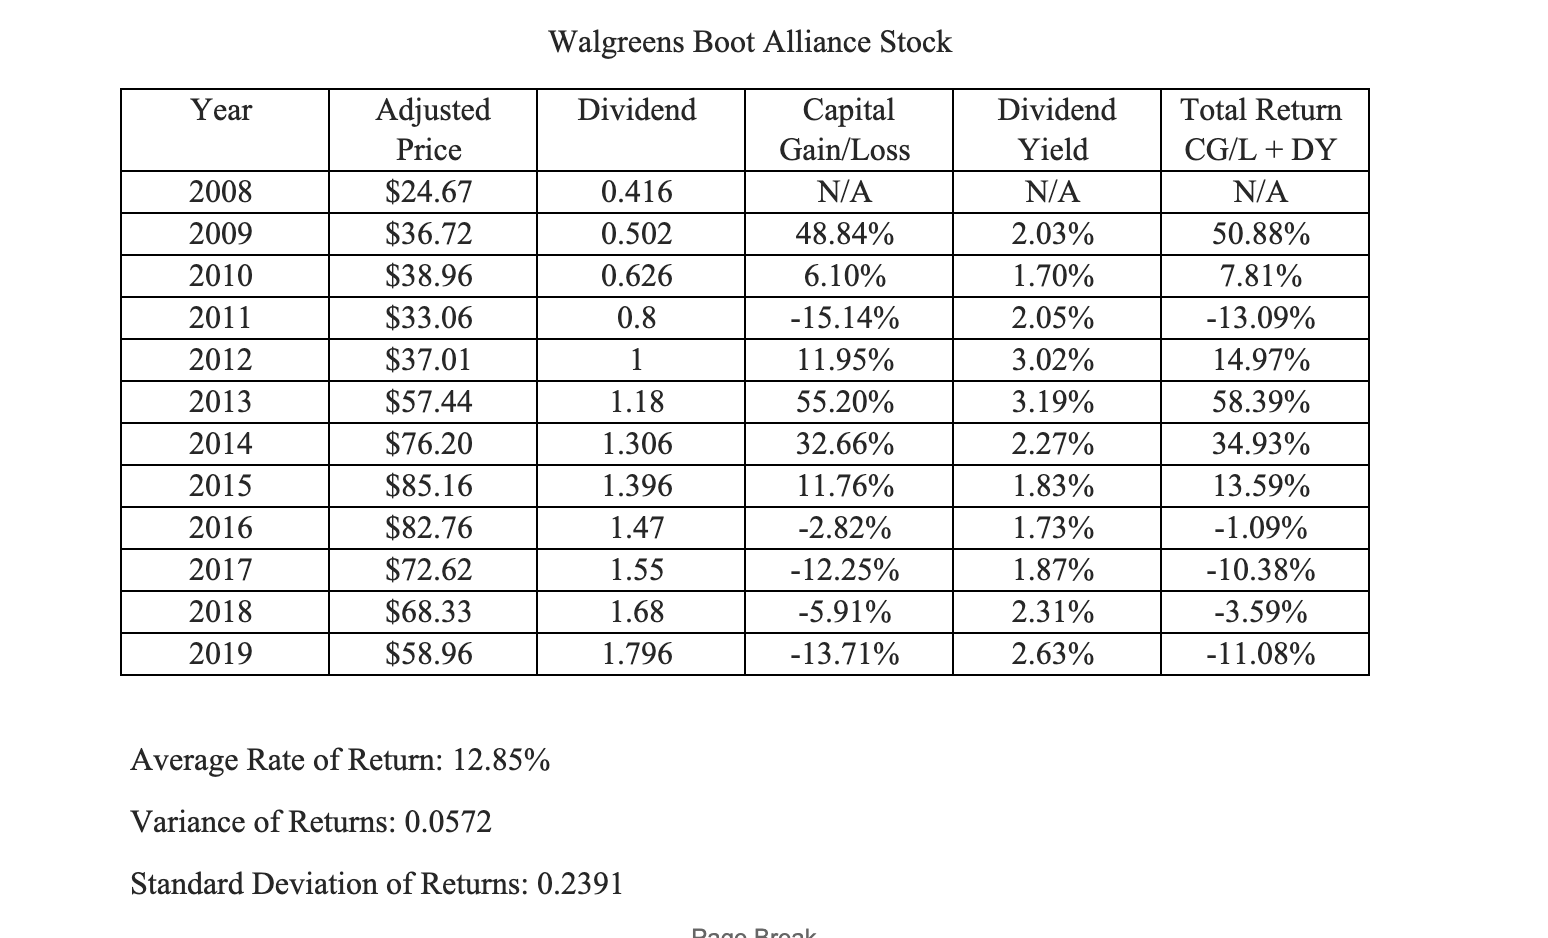
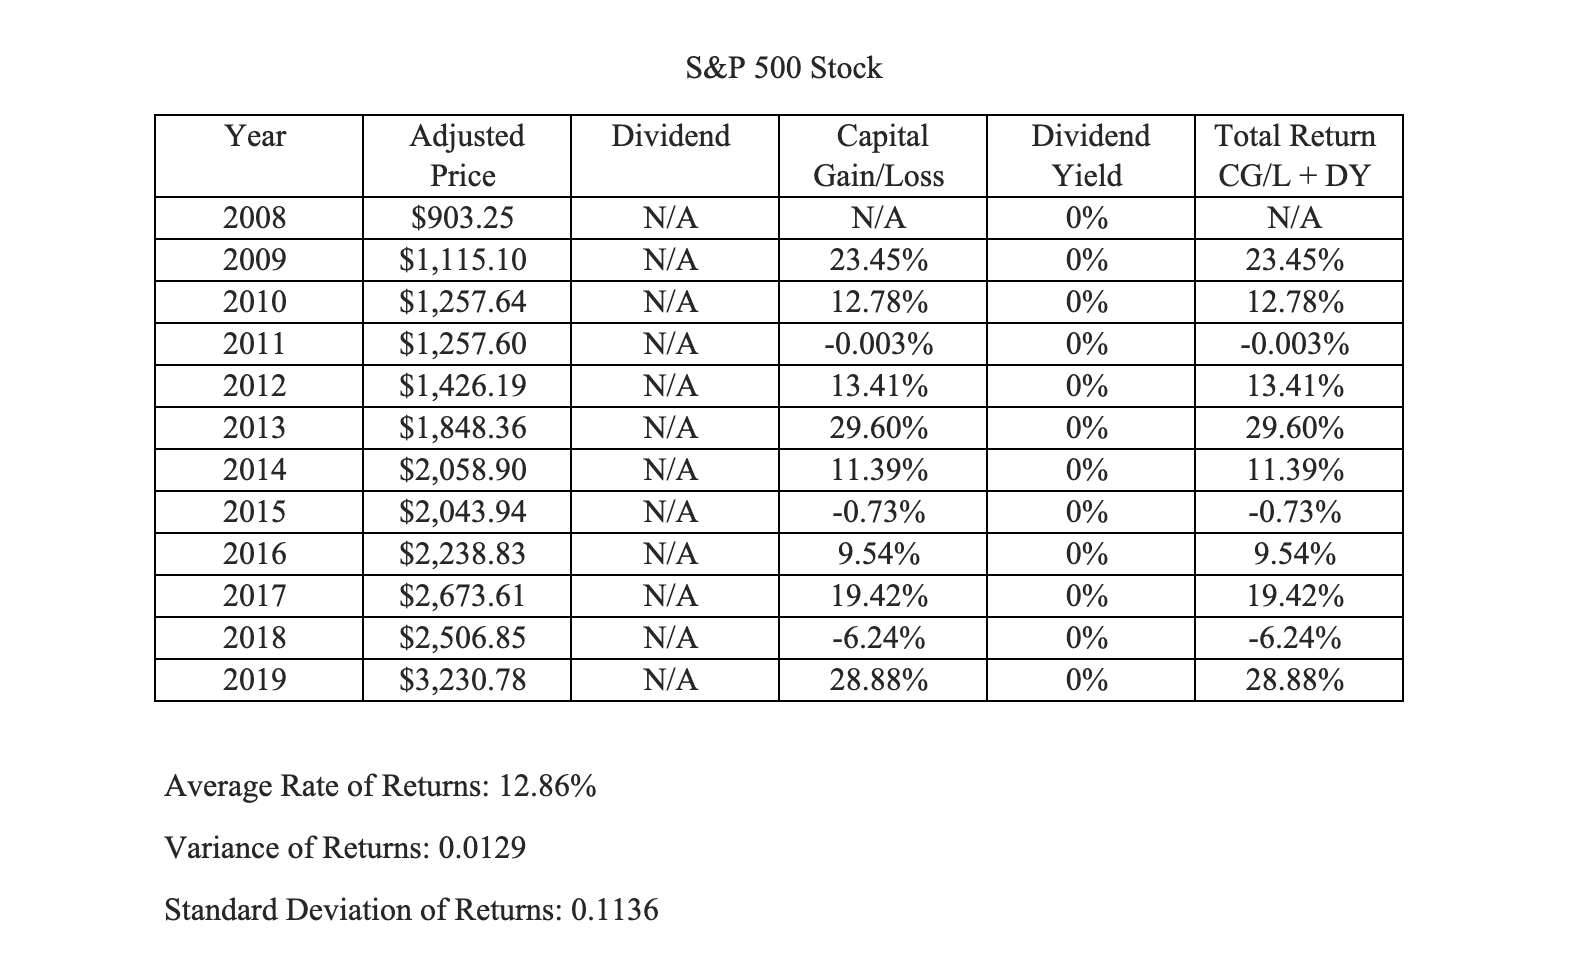
Obtain a beta estimate for your Walgreens. What does it mean? Examine and compare the annual total returns and the average returns of your stock
Obtain a beta estimate for your Walgreens. What does it mean? Examine and compare the annual total returns and the average returns of your stock with that of the S&P500's returns. Did it follow the Beta estimate? It would be helpful to illustrate the returns of the company's(Walgreens) stock and the market.


Walgreens Boot Alliance Stock Year Adjusted Dividend Capital Dividend Total Return Price Gain/Loss Yield CG/L + DY 2008 $24.67 0.416 N/A N/A N/A 2009 $36.72 0.502 48.84% 2.03% 50.88% 2010 $38.96 0.626 6.10% 1.70% 7.81% 2011 $33.06 0.8 -15.14% 2.05% -13.09% 2012 $37.01 1 11.95% 3.02% 14.97% 2013 $57.44 1.18 55.20% 3.19% 58.39% 2014 $76.20 1.306 32.66% 2.27% 34.93% 2015 $85.16 1.396 11.76% 1.83% 13.59% 2016 $82.76 1.47 -2.82% 1.73% -1.09% 2017 $72.62 1.55 -12.25% 1.87% -10.38% 2018 $68.33 1.68 -5.91% 2.31% -3.59% 2019 $58.96 1.796 -13.71% 2.63% -11.08% Average Rate of Return: 12.85% Variance of Returns: 0.0572 Standard Deviation of Returns: 0.2391 Dege Brook
Step by Step Solution
There are 3 Steps involved in it
Step: 1

See step-by-step solutions with expert insights and AI powered tools for academic success
Step: 2

Step: 3

Ace Your Homework with AI
Get the answers you need in no time with our AI-driven, step-by-step assistance
Get Started


