

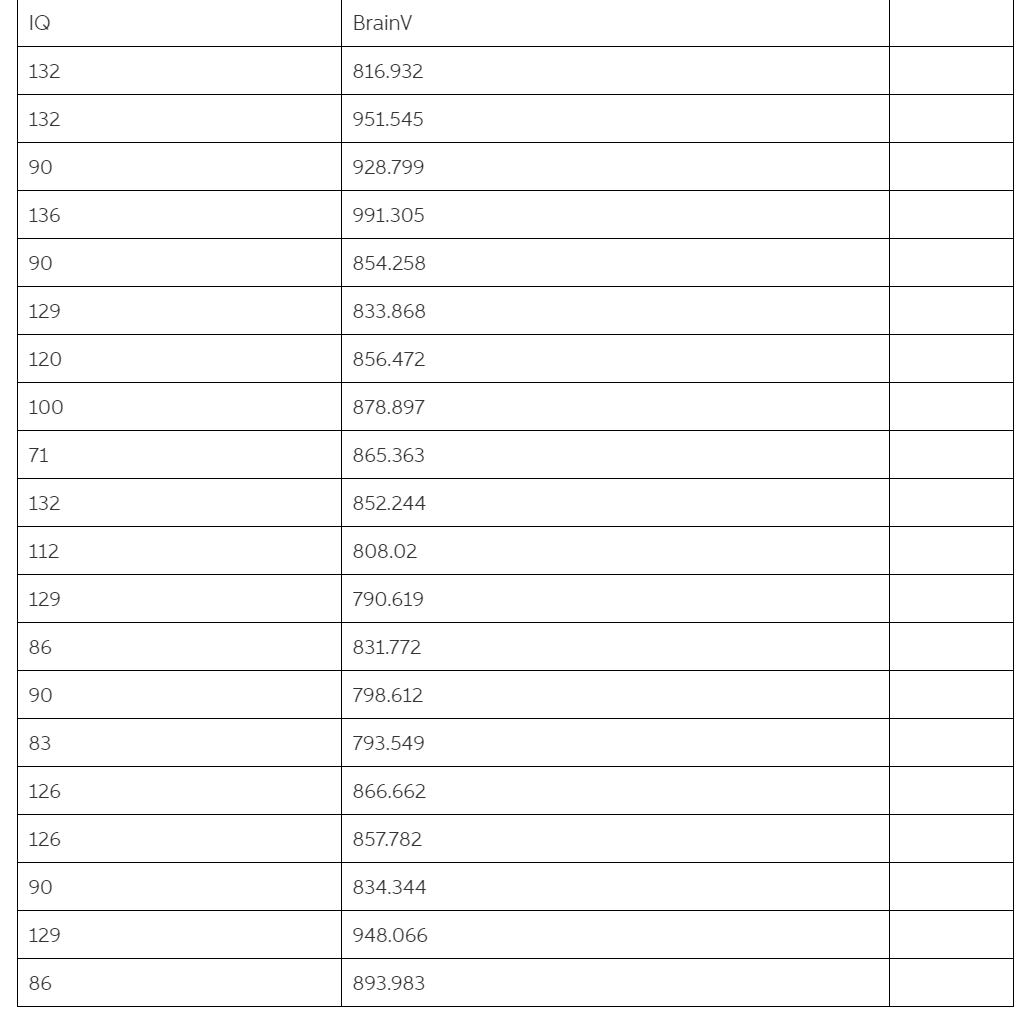
Obtain the following R output, treating IQ as the response variable: (i) scatter plot (ii) standardised residual plot (iii) distribution of residuals Could you please
Obtain the following R output, treating IQ as the response variable: (i) scatter plot (ii) standardised residual plot (iii) distribution of residuals
Could you please help me with the R code for (iii). I have done the histogram but there is gap between the bins and look bit weird .
What statistical model is assumed in your regression analysis?
As far as possible, assess the extent to which the model is appropriate to the data.?
Step by Step Solution
There are 3 Steps involved in it
Step: 1

See step-by-step solutions with expert insights and AI powered tools for academic success
Step: 2

Step: 3
Ace Your Homework with AI
Get the answers you need in no time with our AI-driven, step-by-step assistance
Get Started
Authors: Joseph Lehner
1st Edition
0486799921, 9780486799926