

Question: Obtain, trial control limits and central line for the data concerning the depth of the shaft keyway. Also Plot the control chart. Subgroup size is
Obtain, trial control limits and central line for the data concerning the depth of the shaft keyway. Also Plot the control chart. Subgroup size is 4. I need a table, graph and calculations please. Use Excel, plot chart for X and R. Nice objective. please attach file so i can see the graph n table Thank you so much
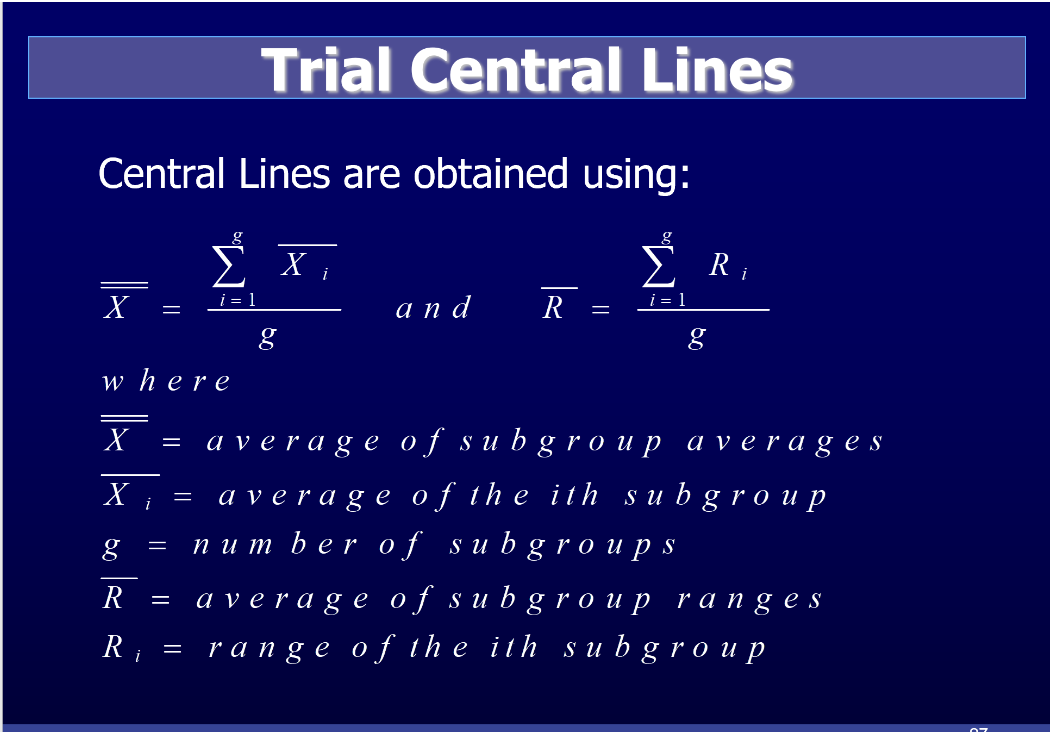
For the CENTRAL LINE use this equation as picture.
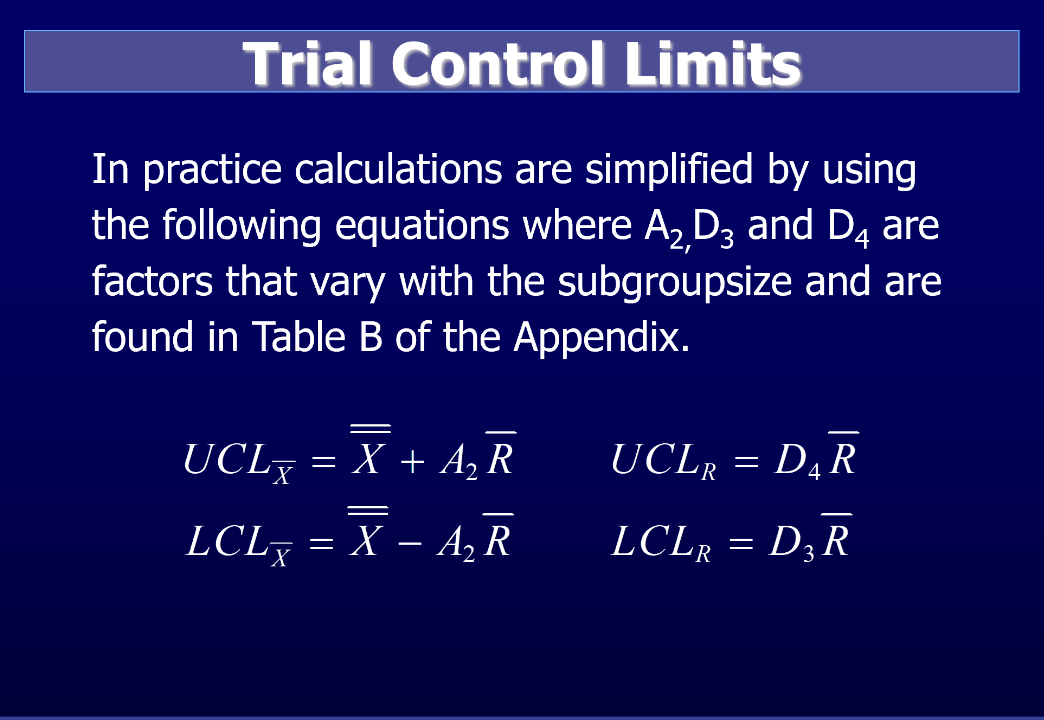
UCL = UPPER CONTROL LIMIT
LCL= LOWER CONTROL LIMIT
EXCEL should look like this as of this picture
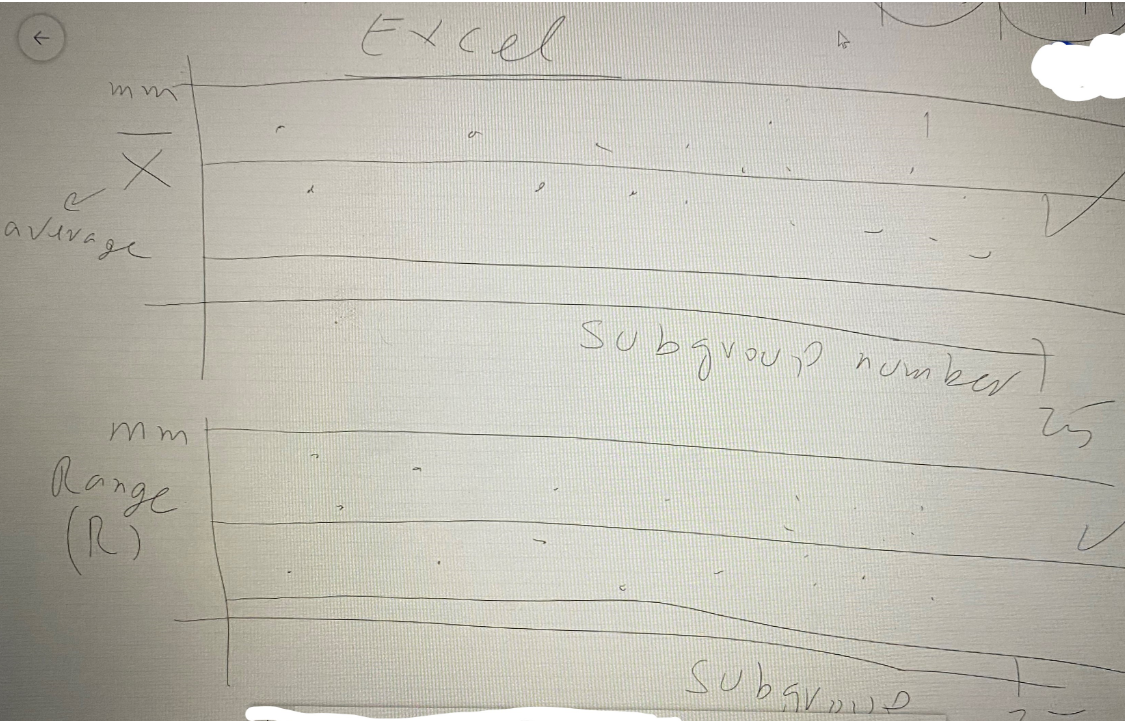
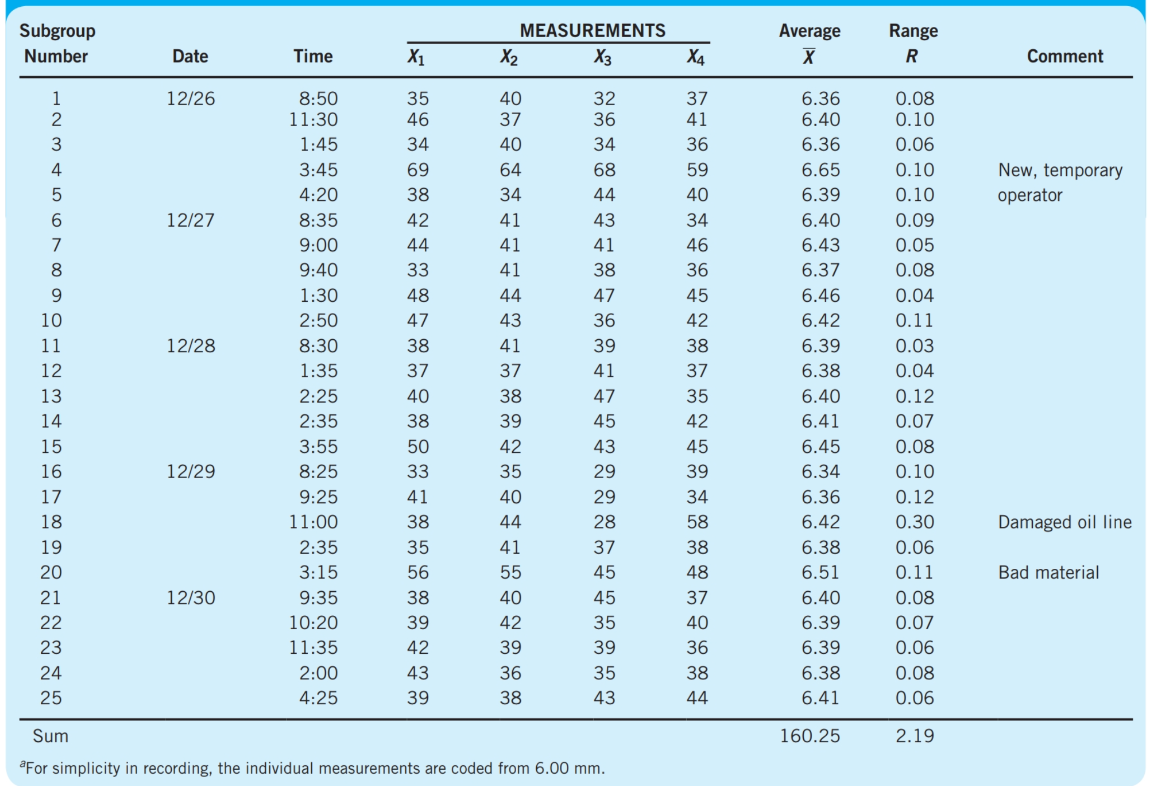
TABLE (B)
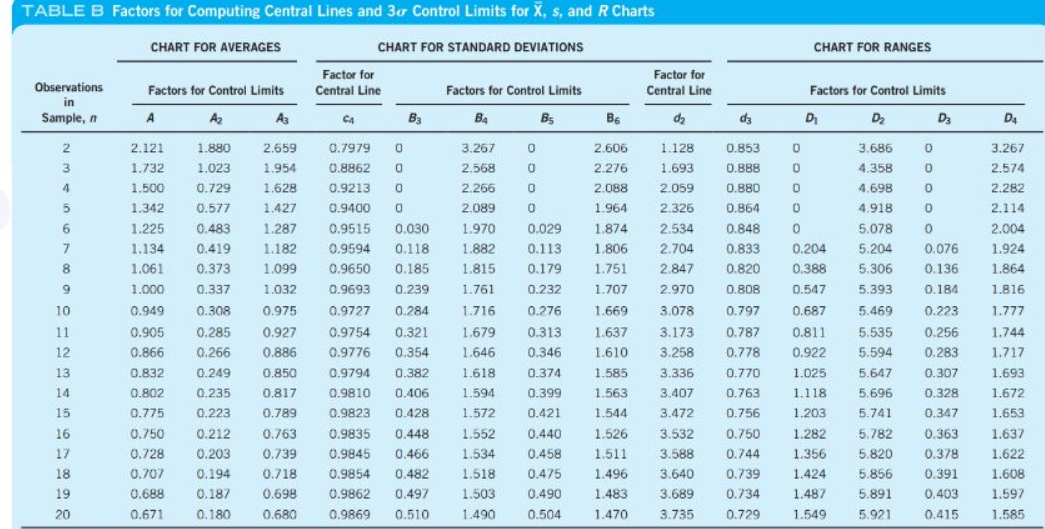
Trial Central Lines Central Lines are obtained using: R, i X = i=1 = i=1 a n d R. - g g where X = = X i = = a verage of sub group averages a verage of the ith subgroup number of sub groups a verage of subgroup ranges range of the ith sub group R = Ri = Trial Control Limits In practice calculations are simplified by using the following equations where A2,D3 and D4 are factors that vary with the subgroupsize and are found in Table B of the Appendix. = UCL = X + A, R UCLR = DAR LCLJ = X AR LCLR = DR Excel X average subgroup number mm Z Range (RO) Subarone Subgroup Number MEASUREMENTS X2 X3 Average Range R Date Time X1 X4 Comment 12/26 New, temporary operator 12/27 12/28 1 2 3 4 5 6 7 8 9 10 11 12 13 14 15 16 17 18 19 20 21 22 23 24 25 8:50 11:30 1:45 3:45 4:20 8:35 9:00 9:40 1:30 2:50 8:30 1:35 2:25 2:35 3:55 8:25 9:25 11:00 2:35 3:15 9:35 10:20 11:35 2:00 4:25 35 46 34 69 38 42 44 33 48 47 38 37 40 38 50 33 41 38 35 56 38 39 42 43 39 40 37 40 64 34 41 41 41 44 43 41 37 38 39 42 35 40 44 41 55 40 42 39 36 38 32 36 34 68 44 43 41 38 47 36 39 41 47 45 43 29 29 28 37 45 45 35 39 35 43 37 41 36 59 40 34 46 36 45 42 38 37 35 42 45 39 34 58 38 48 37 40 36 38 44 6.36 6.40 6.36 6.65 6.39 6.40 6.43 6.37 6.46 6.42 6.39 6.38 6.40 6.41 6.45 6.34 6.36 6.42 6.38 6.51 6.40 6.39 6.39 6.38 6.41 0.08 0.10 0.06 0.10 0.10 0.09 0.05 0.08 0.04 0.11 0.03 0.04 0.12 0.07 0.08 0.10 0.12 0.30 0.06 0.11 0.08 0.07 0.06 0.08 0.06 12/29 Damaged oil line Bad material 12/30 Sum 160.25 2.19 a For simplicity in recording, the individual measurements are coded from 6.00 mm. TABLE B Factors for Computing Central Lines and 3c Control Limits for X, s, and R Charts CHART FOR AVERAGES CHART FOR RANGES Factor for Central Line CHART FOR STANDARD DEVIATIONS Factor for Central Line Factors for Control Limits C4 B3 BA Bs Factors for Control Limits Observations in Sample, n Factors for Control Limits Az A3 6 dz D2 Dz D4 0 0 2 2 3 4 5 2.659 1.954 1.628 0 0 0 0 0 0 0.853 0.888 0.880 0.864 0.848 1.427 0.7979 0.8862 0.9213 0.9400 0.9515 0.9594 0.9650 3.267 2.568 2.266 2.089 1.970 1.882 1.815 1.128 1.693 2.059 2.326 2.534 2.704 2.847 0 1.880 1.023 0.729 0.577 0.483 0.419 0.373 0.337 0.308 0.285 0.266 0.249 0 0.030 0.118 0.185 6 7 3.686 4.358 4.698 4.918 5.078 5.204 5.306 1.287 1.182 1.099 0.833 0 0.204 0.388 0.547 8 9 1.032 0.9693 0.239 3.267 2.574 2.282 2.114 2.004 1.924 1.864 1.816 1.777 1.744 1.717 1.693 1.672 1.653 1.761 2.970 5.393 10 2.121 1.732 1.500 1.342 1.225 1.134 1.061 1.000 0.949 0.905 0.866 0.832 0.802 0.775 0.750 0.728 0.707 0.688 0.671 0.687 11 12 13 14 15 16 17 1.716 1.679 1.646 1.618 0.284 0.321 0.354 0.382 0.406 0.428 0 0 0 0 0.029 0.113 0.179 0.232 0.276 0.313 0.346 0.374 0.399 0.421 0.440 0.458 0.475 0.490 0.504 2.606 2.276 2.088 1.964 1.874 1.806 1.751 1.707 1.669 1.637 1.610 1.585 1.563 1.544 1.526 1.511 1.496 1.483 1.470 0.975 0.927 0.886 0.850 0.817 0.789 0.763 0.739 0.718 0.698 0.680 0.9727 0.9754 0.9776 0.9794 0.9810 0.9823 0.9835 0.9845 0.9854 0.9862 0.9869 0.235 1.594 0.820 0.808 0.797 0.787 0.778 0.770 0.763 0.756 0.750 0.744 0.739 0.734 0.729 0.223 0 0 0.076 0.136 0.184 0.223 0.256 0.283 0.307 0.328 0.347 0.363 0.378 0.391 0,403 0.415 3.078 3.173 3.258 3.336 3.407 3.472 3.532 3.588 3.640 3.689 3.735 0.811 0.922 1.025 1.118 1.203 1.282 1.356 1.424 1.487 1.549 5.469 5.535 5.594 5.647 5.696 5.741 5.782 5.820 5.856 5.891 5.921 1.572 1.552 1.534 1.518 1.503 1.490 0.212 0.203 0.194 0.448 0.466 0.482 0.497 0.510 18 19 1.637 1.622 1.608 1.597 1.585 0.187 0.180 20 Trial Central Lines Central Lines are obtained using: R, i X = i=1 = i=1 a n d R. - g g where X = = X i = = a verage of sub group averages a verage of the ith subgroup number of sub groups a verage of subgroup ranges range of the ith sub group R = Ri = Trial Control Limits In practice calculations are simplified by using the following equations where A2,D3 and D4 are factors that vary with the subgroupsize and are found in Table B of the Appendix. = UCL = X + A, R UCLR = DAR LCLJ = X AR LCLR = DR Excel X average subgroup number mm Z Range (RO) Subarone Subgroup Number MEASUREMENTS X2 X3 Average Range R Date Time X1 X4 Comment 12/26 New, temporary operator 12/27 12/28 1 2 3 4 5 6 7 8 9 10 11 12 13 14 15 16 17 18 19 20 21 22 23 24 25 8:50 11:30 1:45 3:45 4:20 8:35 9:00 9:40 1:30 2:50 8:30 1:35 2:25 2:35 3:55 8:25 9:25 11:00 2:35 3:15 9:35 10:20 11:35 2:00 4:25 35 46 34 69 38 42 44 33 48 47 38 37 40 38 50 33 41 38 35 56 38 39 42 43 39 40 37 40 64 34 41 41 41 44 43 41 37 38 39 42 35 40 44 41 55 40 42 39 36 38 32 36 34 68 44 43 41 38 47 36 39 41 47 45 43 29 29 28 37 45 45 35 39 35 43 37 41 36 59 40 34 46 36 45 42 38 37 35 42 45 39 34 58 38 48 37 40 36 38 44 6.36 6.40 6.36 6.65 6.39 6.40 6.43 6.37 6.46 6.42 6.39 6.38 6.40 6.41 6.45 6.34 6.36 6.42 6.38 6.51 6.40 6.39 6.39 6.38 6.41 0.08 0.10 0.06 0.10 0.10 0.09 0.05 0.08 0.04 0.11 0.03 0.04 0.12 0.07 0.08 0.10 0.12 0.30 0.06 0.11 0.08 0.07 0.06 0.08 0.06 12/29 Damaged oil line Bad material 12/30 Sum 160.25 2.19 a For simplicity in recording, the individual measurements are coded from 6.00 mm. TABLE B Factors for Computing Central Lines and 3c Control Limits for X, s, and R Charts CHART FOR AVERAGES CHART FOR RANGES Factor for Central Line CHART FOR STANDARD DEVIATIONS Factor for Central Line Factors for Control Limits C4 B3 BA Bs Factors for Control Limits Observations in Sample, n Factors for Control Limits Az A3 6 dz D2 Dz D4 0 0 2 2 3 4 5 2.659 1.954 1.628 0 0 0 0 0 0 0.853 0.888 0.880 0.864 0.848 1.427 0.7979 0.8862 0.9213 0.9400 0.9515 0.9594 0.9650 3.267 2.568 2.266 2.089 1.970 1.882 1.815 1.128 1.693 2.059 2.326 2.534 2.704 2.847 0 1.880 1.023 0.729 0.577 0.483 0.419 0.373 0.337 0.308 0.285 0.266 0.249 0 0.030 0.118 0.185 6 7 3.686 4.358 4.698 4.918 5.078 5.204 5.306 1.287 1.182 1.099 0.833 0 0.204 0.388 0.547 8 9 1.032 0.9693 0.239 3.267 2.574 2.282 2.114 2.004 1.924 1.864 1.816 1.777 1.744 1.717 1.693 1.672 1.653 1.761 2.970 5.393 10 2.121 1.732 1.500 1.342 1.225 1.134 1.061 1.000 0.949 0.905 0.866 0.832 0.802 0.775 0.750 0.728 0.707 0.688 0.671 0.687 11 12 13 14 15 16 17 1.716 1.679 1.646 1.618 0.284 0.321 0.354 0.382 0.406 0.428 0 0 0 0 0.029 0.113 0.179 0.232 0.276 0.313 0.346 0.374 0.399 0.421 0.440 0.458 0.475 0.490 0.504 2.606 2.276 2.088 1.964 1.874 1.806 1.751 1.707 1.669 1.637 1.610 1.585 1.563 1.544 1.526 1.511 1.496 1.483 1.470 0.975 0.927 0.886 0.850 0.817 0.789 0.763 0.739 0.718 0.698 0.680 0.9727 0.9754 0.9776 0.9794 0.9810 0.9823 0.9835 0.9845 0.9854 0.9862 0.9869 0.235 1.594 0.820 0.808 0.797 0.787 0.778 0.770 0.763 0.756 0.750 0.744 0.739 0.734 0.729 0.223 0 0 0.076 0.136 0.184 0.223 0.256 0.283 0.307 0.328 0.347 0.363 0.378 0.391 0,403 0.415 3.078 3.173 3.258 3.336 3.407 3.472 3.532 3.588 3.640 3.689 3.735 0.811 0.922 1.025 1.118 1.203 1.282 1.356 1.424 1.487 1.549 5.469 5.535 5.594 5.647 5.696 5.741 5.782 5.820 5.856 5.891 5.921 1.572 1.552 1.534 1.518 1.503 1.490 0.212 0.203 0.194 0.448 0.466 0.482 0.497 0.510 18 19 1.637 1.622 1.608 1.597 1.585 0.187 0.180 20
Step by Step Solution
There are 3 Steps involved in it

Get step-by-step solutions from verified subject matter experts