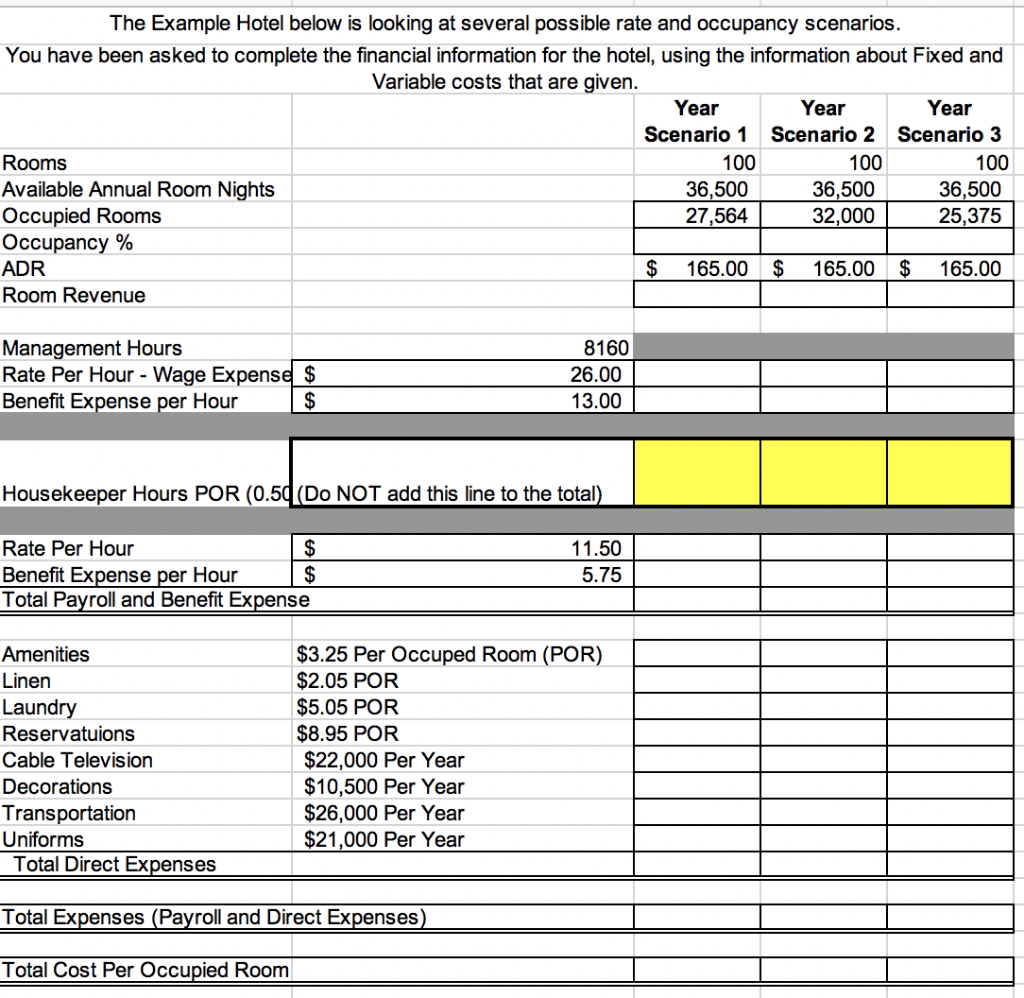
Occupancy %:
year 1 75.5% | year 2 87.6% | year 3 69.5% |
The Example Hotel below is looking at several possible rate and occupancy scenarios. You have been asked to complete the financial information for the hotel, using the information about Fixed and Variable costs that are given. Year Year Year Scenario 1 Scenario 2 Scenario 3 Rooms 100 100 100 Available Annual Room Nights 36,500 36,500 36,500 Occupied Rooms 27,564 32,000 25,375 Occupancy % ADR $ 165.00 $ 165.00 $ 165.00 Room Revenue Management Hours Rate Per Hour - Wage Expense $ Benefit Expense per Hour $ 8160 26.00 13.00 Housekeeper Hours POR (0.5d (Do NOT add this line to the total) Rate Per Hour $ Benefit Expense per Hour $ Total Payroll and Benefit Expense 11.50 5.75 Amenities Linen Laundry Reservatuions Cable Television Decorations Transportation Uniforms Total Direct Expenses $3.25 Per Occuped Room (POR) $2.05 POR $5.05 POR $8.95 POR $22,000 Per Year $10,500 Per Year $26,000 Per Year $21,000 Per Year Total Expenses (Payroll and Direct Expenses Total Cost Per Occupied Room The Example Hotel below is looking at several possible rate and occupancy scenarios. You have been asked to complete the financial information for the hotel, using the information about Fixed and Variable costs that are given. Year Year Year Scenario 1 Scenario 2 Scenario 3 Rooms 100 100 100 Available Annual Room Nights 36,500 36,500 36,500 Occupied Rooms 27,564 32,000 25,375 Occupancy % ADR $ 165.00 $ 165.00 $ 165.00 Room Revenue Management Hours Rate Per Hour - Wage Expense $ Benefit Expense per Hour $ 8160 26.00 13.00 Housekeeper Hours POR (0.5d (Do NOT add this line to the total) Rate Per Hour $ Benefit Expense per Hour $ Total Payroll and Benefit Expense 11.50 5.75 Amenities Linen Laundry Reservatuions Cable Television Decorations Transportation Uniforms Total Direct Expenses $3.25 Per Occuped Room (POR) $2.05 POR $5.05 POR $8.95 POR $22,000 Per Year $10,500 Per Year $26,000 Per Year $21,000 Per Year Total Expenses (Payroll and Direct Expenses Total Cost Per Occupied Room