Ocean Carriers Case
1. What is the free cash flow for the first year that the ship is in operation (end of 2003)?
2. What is the change in NWC for the first and second years that the ship is operated?
3. What is the change in NWC for the last year and second to last year that the ship is
to another firm after 15 years. Does this choice affect the valuation of the project? Note: This question can be solved by making a qualitative argument.
5. What do you think of the companys policy of not operating ships over 15 years old? Note:
Again, think about this from a qualitative standpoint.
operated?
4. Show how the first survey, which occurs in 2007, affects the FCFs (on a timeline) over the
period from 2007 to 2011.
5. Suppose that a U.S. firm is subject to a 35% taxation rate and assume that Ocean Carriers
operates their ships for the entirety of the ships useful life. Find the NPV of the project.
Should the ship be purchased?
6. Now suppose that Ocean Carriers is located in Hong Kong, where ships are not required
to pay any tax on profits made overseas and are also exempted from paying any tax on
profit made on cargo uplifted from Hong Kong. What is the value of the FCF for the first
year the ship is in operation (end of 2003)?
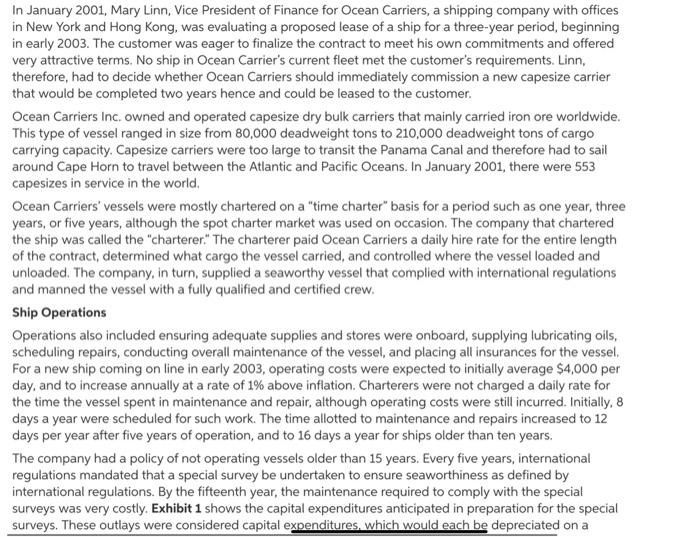
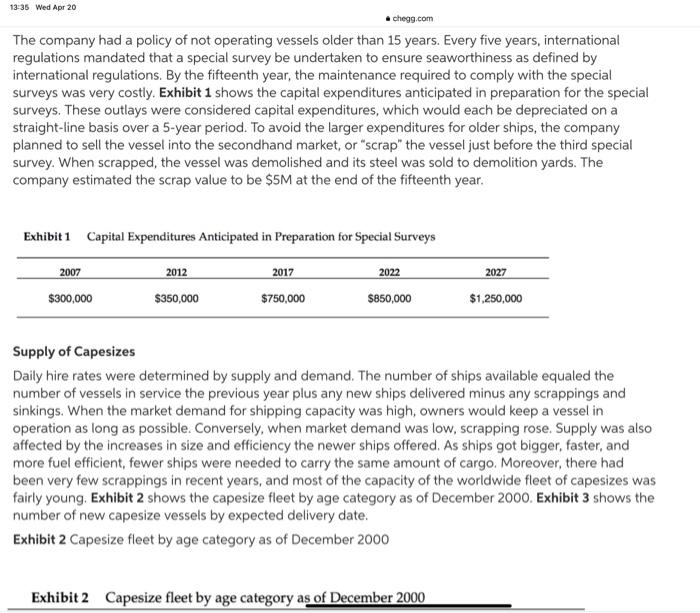
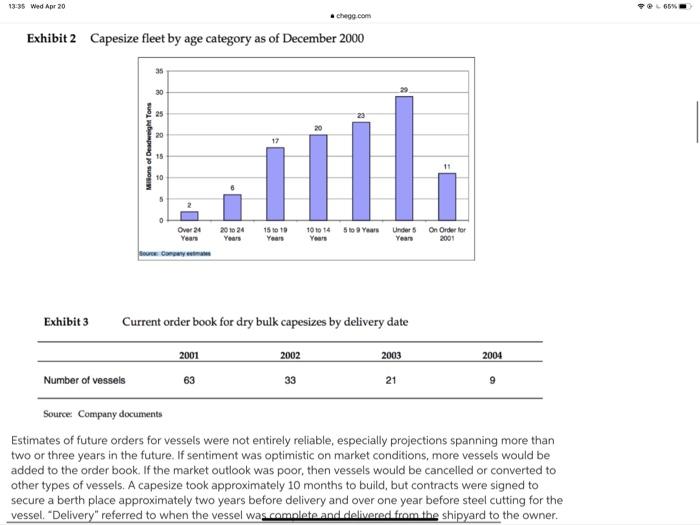
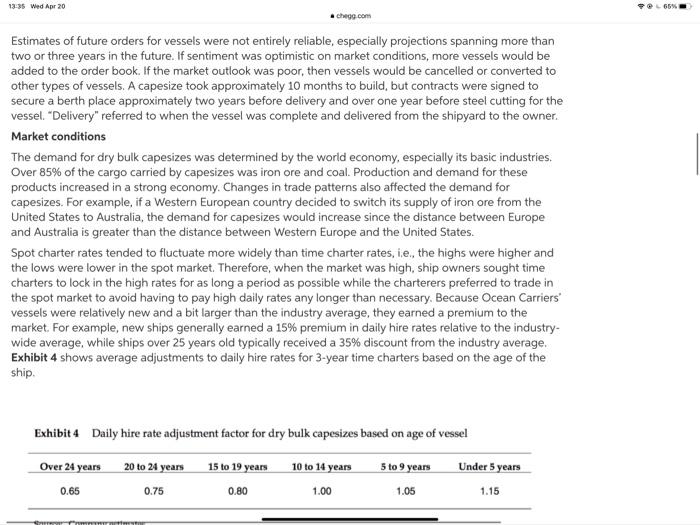
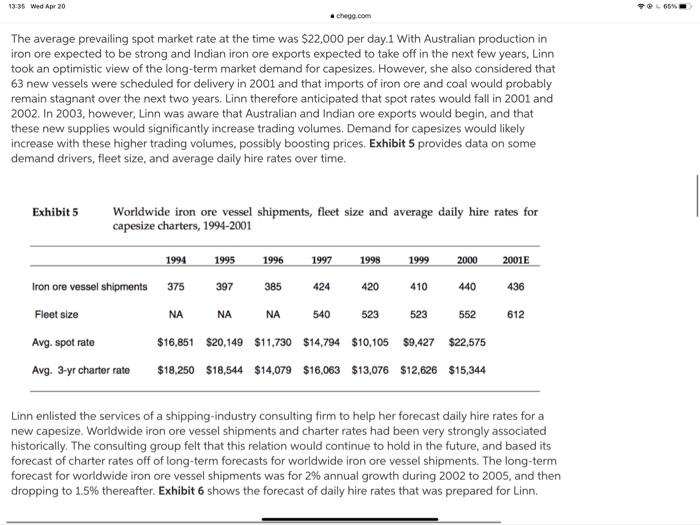
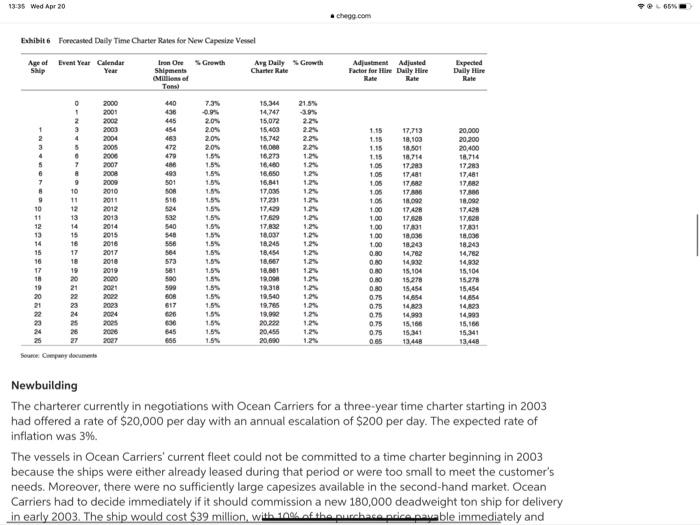
In January 2001, Mary Linn, Vice President of Finance for Ocean Carriers, a shipping company with offices in New York and Hong Kong, was evaluating a proposed lease of a ship for a three-year period, beginning in early 2003. The customer was eager to finalize the contract to meet his own commitments and offered very attractive terms. No ship in Ocean Carrier's current fleet met the customer's requirements. Linn, therefore, had to decide whether Ocean Carriers should immediately commission a new capesize carrier that would be completed two years hence and could be leased to the customer. Ocean Carriers Inc. owned and operated capesize dry bulk carriers that mainly carried iron ore worldwide. This type of vessel ranged in size from 80,000 deadweight tons to 210,000 deadweight tons of cargo carrying capacity. Capesize carriers were too large to transit the Panama Canal and therefore had to sail around Cape Horn to travel between the Atlantic and Pacific Oceans. In January 2001, there were 553 capesizes in service in the world. Ocean Carriers' vessels were mostly chartered on a "time charter" basis for a period such as one year, three years, or five years, although the spot charter market was used on occasion. The company that chartered the ship was called the "charterer. The charterer paid Ocean Carriers a daily hire rate for the entire length of the contract, determined what cargo the vessel carried, and controlled where the vessel loaded and unloaded. The company, in turn, supplied a seaworthy vessel that complied with international regulations and manned the vessel with a fully qualified and certified crew. Ship Operations Operations also included ensuring adequate supplies and stores were onboard, supplying lubricating oils, scheduling repairs, conducting overall maintenance of the vessel, and placing all insurances for the vessel. For a new ship coming on line in early 2003, operating costs were expected to initially average $4,000 per day, and to increase annually at a rate of 1% above inflation Charterers were not charged a daily rate for the time the vessel spent in maintenance and repair, although operating costs were still incurred. Initially, 8 days a year were scheduled for such work. The time allotted to maintenance and repairs increased to 12 days per year after five years of operation, and to 16 days a year for ships older than ten years. The company had a policy of not operating vessels older than 15 years. Every five years, international regulations mandated that a special survey be undertaken to ensure seaworthiness as defined by international regulations. By the fifteenth year, the maintenance required to comply with the special surveys was very costly. Exhibit 1 shows the capital expenditures anticipated in preparation for the special surveys. These outlays were considered capital expenditures, which would each be depreciated on a 13-35 Wed Apr 20 chegg.com The company had a policy of not operating vessels older than 15 years. Every five years, international regulations mandated that a special survey be undertaken to ensure seaworthiness as defined by international regulations. By the fifteenth year, the maintenance required to comply with the special surveys was very costly. Exhibit 1 shows the capital expenditures anticipated in preparation for the special surveys. These outlays were considered capital expenditures, which would each be depreciated on a straight-line basis over a 5-year period. To avoid the larger expenditures for older ships, the company planned to sell the vessel into the secondhand market, or "scrap" the vessel just before the third special survey. When scrapped, the vessel was demolished and its steel was sold to demolition yards. The company estimated the scrap value to be $5M at the end of the fifteenth year. Exhibit 1 Capital Expenditures Anticipated in Preparation for Special Surveys 2007 2022 2027 2012 $350,000 2017 $750,000 $300,000 $850,000 $1,250,000 Supply of Capesizes Daily hire rates were determined by supply and demand. The number of ships available equaled the number of vessels in service the previous year plus any new ships delivered minus any scrappings and sinkings. When the market demand for shipping capacity was high, owners would keep a vessel in operation as long as possible. Conversely, when market demand was low, scrapping rose. Supply was also affected by the increases in size and efficiency the newer ships offered. As ships got bigger, faster, and more fuel efficient, fewer ships were needed to carry the same amount of cargo. Moreover, there had been very few scrappings in recent years, and most of the capacity of the worldwide fleet of capesizes was fairly young, Exhibit 2 shows the capesize fleet by age category as of December 2000. Exhibit 3 shows the number of new capesize vessels by expected delivery date. Exhibit 2 Capesize fleet by age category as of December 2000 Exhibit 2 Capesize fleet by age category as of December 2000 13-35 Wed Apr 20 65% .chegg.com Exhibit 2 Capesize fleet by age category as of December 2000 0 25 17 Mons of Deadweight Tons 15 10 5 20 10 24 5 to 9 Years Unders Over 24 Year Sorowy 15 10 Year 10 10 14 Years On Order for 2001 Exhibit 3 Current order book for dry bulk capesizes by delivery date 2001 2003 2004 2002 33 Number of vessels 63 21 Source: Company documents Estimates of future orders for vessels were not entirely reliable, especially projections spanning more than two or three years in the future. If sentiment was optimistic on market conditions, more vessels would be added to the order book. If the market outlook was poor, then vessels would be cancelled or converted to other types of vessels. A capesize took approximately 10 months to build, but contracts were signed to secure a berth place approximately two years before delivery and over one year before steel cutting for the vessel. "Delivery" referred to when the vessel was complete and delivered from the shipyard to the owner. 13-35 Wed Apr 20 65% .chegg.com Estimates of future orders for vessels were not entirely reliable, especially projections spanning more than two or three years in the future. If sentiment was optimistic on market conditions, more vessels would be added to the order book. If the market outlook was poor, then vessels would be cancelled or converted to other types of vessels. A capesize took approximately 10 months to build, but contracts were signed to secure a berth place approximately two years before delivery and over one year before steel cutting for the vessel. "Delivery" referred to when the vessel was complete and delivered from the shipyard to the owner. Market conditions The demand for dry bulk capesizes was determined by the world economy, especially its basic industries. Over 85% of the cargo carried by capesizes was iron ore and coal. Production and demand for these products increased in a strong economy. Changes in trade patterns also affected the demand for capesizes. For example, if a Western European country decided to switch its supply of iron ore from the United States to Australia, the demand for capesizes would increase since the distance between Europe and Australia is greater than the distance between Western Europe and the United States. Spot charter rates tended to fluctuate more widely than time charter rates, ie, the highs were higher and the lows were lower in the spot market. Therefore, when the market was high, ship owners sought time charters to lock in the high rates for as long a period as possible while the charterers preferred to trade in the spot market to avoid having to pay high daily rates any longer than necessary. Because Ocean Carriers vessels were relatively new and a bit larger than the industry average, they earned a premium to the market. For example, new ships generally earned a 15% premium in daily hire rates relative to the industry- wide average, while ships over 25 years old typically received a 35% discount from the industry average. Exhibit 4 shows average adjustments to daily hire rates for 3-year time charters based on the age of the ship. Exhibit 4 Daily hire rate adjustment factor for dry bulk capesizes based on age of vessel Over 24 years 20 to 24 years 15 to 19 years 10 to 14 years 5 to 9 years Under 5 years 0.65 0.75 0.80 1.00 1.05 1.15 13-35 Wed Apr 20 65% .chegg.com The average prevailing spot market rate at the time was $22,000 per day 1 With Australian production in iron ore expected to be strong and Indian iron ore exports expected to take off in the next few years, Linn took an optimistic view of the long-term market demand for capesizes. However, she also considered that 63 new vessels were scheduled for delivery in 2001 and that imports of iron ore and coal would probably remain stagnant over the next two years. Linn therefore anticipated that spot rates would fall in 2001 and 2002. In 2003, however, Linn was aware that Australian and Indian ore exports would begin, and that these new supplies would significantly increase trading volumes. Demand for capesizes would likely increase with these higher trading volumes, possibly boosting prices. Exhibit 5 provides data on some demand drivers, fleet size, and average daily hire rates over time. Exhibit 5 Worldwide iron ore vessel shipments, fleet size and average daily hire rates for capesize charters, 1994-2001 1994 1995 1996 1997 1998 1999 2000 2001E 375 397 385 424 420 410 440 436 NA NA NA 540 523 523 552 612 Iron ore vessel shipments Fleet size Avg. spot rate Avg. 3-yr charter rate $16,851 $20,149 $11,730 $14,794 $10,105 $9.427 $22,575 $18,250 $18,544 $14,079 $16,063 $13,076 $12,626 $15,344 Linn enlisted the services of a shipping-industry consulting firm to help her forecast daily hire rates for a new capesize. Worldwide iron ore vessel shipments and charter rates had been very strongly associated historically. The consulting group felt that this relation would continue to hold in the future, and based its forecast of charter rates off of long-term forecasts for worldwide iron ore vessel shipments. The long-term forecast for worldwide iron ore vessel shipments was for 2% annual growth during 2002 to 2005, and then dropping to 1.5% thereafter. Exhibit 6 shows the forecast of daily hire rates that was prepared for Linn. 13-35 Wed Apr 20 65% chegg.com Exhibit6 Forecasted Daily Time Charter Rates for New Capesire Vessel Age of Event Year Calendar Ship Year Ang Daily Growth Charter Rate Adjustment Adjusted Factor for Hire Daily Hire Rate Rate Expected Daily Rate 0 1 0. 15.344 14.747 215 -3.9% 45 Iron One Growth Shipments Millions of Tom 440 73 430 20% 454 20% 463 2.0% 472 20% 479 1.54 486 1.5% 493 1.5% 501 13 SOR 1.84 15.072 3 15.400 15.742 16.000 16.273 3 . 7 8 9 10 11 12 13 2.2% 2.25 22 12 124 1.25 12 12 1.21 20,000 20.200 20,400 18.714 17283 17,481 17.682 17.00 16.650 16,641 17.03 17.231 510 2000 2001 2002 2003 2004 2005 2000 2007 2008 2009 2010 2011 2012 2013 2014 2015 2016 2017 2010 2019 2000 2021 2022 2003 2004 2005 124 12 7 8 9 10 11 12 13 14 15 10 17 18 19 20 21 22 23 24 1.24 15 16 17 18 19 20 21 1.5% 532 15 540 1.5% 548 1.5% 558 1.5% 564 15% 57a 1.8% 501 500 1.54 590 154 608 1.5% 817 826 18 1.54 845 865 1.5% 1.15 1.15 1.15 1.15 1.05 105 105 105 1.05 1.00 1.00 1.00 1 00 100 0.80 0.00 0.80 0.80 0.80 0.75 0.75 0.75 0.75 0.75 0.85 1.24 1.24 125 17,719 18,103 18.501 18.714 17.283 17,481 17,662 17.30 18.092 17,428 17,428 17801 18.000 18.243 14,762 14,832 15.104 15.278 15,454 14,654 14,823 14.99 15.166 15.11 17,629 17.632 18,037 18.245 18.454 18.667 18,681 18.000 19.318 19.540 19.785 18.00 15 1.24 17,428 17.628 17,831 18.000 18,243 14,784 14,902 15.104 15.278 15.454 1485 14,123 14.900 15.166 15.341 13.448 126 12% RENRX 23 24 25 12 12% 1.25 27 2027 20,000 Some Company documents Newbuilding The charterer currently in negotiations with Ocean Carriers for a three-year time charter starting in 2003 had offered a rate of $20,000 per day with an annual escalation of $200 per day. The expected rate of inflation was 3%. The vessels in Ocean Carriers' current fleet could not be committed to a time charter beginning in 2003 because the ships were either already leased during that period or were too small to meet the customer's needs. Moreover, there were no sufficiently large capesizes available in the second-hand market. Ocean Carriers had to decide immediately if it should commission a new 180,000 deadweight ton ship for delivery in early 2003. The ship would cost $39 million, with 100% of the purchase price payable immediately and 13:35 Wed Apr 20 - chegg.com The vessels in Ocean Carriers' current fleet could not be committed to a time charter beginning in 2003 because the ships were either already leased during that period or were too small to meet the customer's needs. Moreover, there were no sufficiently large capesizes available in the second-hand market. Ocean Carriers had to decide immediately if it should commission a new 180,000 deadweight ton ship for delivery in early 2003. The ship would cost $39 million, with 10% of the purchase price payable immediately and 10% due in a year's time. The balance would be due on delivery. A new ship would be depreciated on a straight-line basis over 25 years. In addition, Linn expected to make a $500,000 initial investment in net working capital, which she anticipated would grow with inflation. Linn was also confident that the charterer would honor his proposed contract with Ocean Carriers if the company agreed to the terms. While there is always a risk that the charterer would stop paying before the end of the contract or terminate the contract early, Linn considered that the risk was small. Ocean Carriers had long established relationships with its charterers and only contracted with reputable charterers. The proposed contract, though, was only for three years, and it was Linn's responsibility to decide if future market conditions warranted the considerable investment in a new ship. Ocean Carriers uses a 9% discount rate. Quantitative Questions 1. What is the free cash flow for the first year that the ship is in operation (end of 2003)? 2. What is the change in NWC for the first and second years that the ship is operated? 3. What is the change in NWC for the last year and second to last year that the ship is operated? 4. Show how the first survey, which occurs in 2007, affects the FCFs (on a timeline) over the period from 2007 to 2011. 5. Suppose that a U.S. firm is subject to a 35% taxation rate and assume that Ocean Carriers operates their ships for the entirety of the ship's useful life. Find the NPV of the project. Should the ship be purchased? 6. Now suppose that Ocean Carriers is located in Hong Kong, where ships are not required to pay any tax on profits made overseas and are also exempted from paying any tax on profit made on cargo uplifted from Hong Kong. What is the value of the FCF for the first year the ship is in operation (end of 2003)? In January 2001, Mary Linn, Vice President of Finance for Ocean Carriers, a shipping company with offices in New York and Hong Kong, was evaluating a proposed lease of a ship for a three-year period, beginning in early 2003. The customer was eager to finalize the contract to meet his own commitments and offered very attractive terms. No ship in Ocean Carrier's current fleet met the customer's requirements. Linn, therefore, had to decide whether Ocean Carriers should immediately commission a new capesize carrier that would be completed two years hence and could be leased to the customer. Ocean Carriers Inc. owned and operated capesize dry bulk carriers that mainly carried iron ore worldwide. This type of vessel ranged in size from 80,000 deadweight tons to 210,000 deadweight tons of cargo carrying capacity. Capesize carriers were too large to transit the Panama Canal and therefore had to sail around Cape Horn to travel between the Atlantic and Pacific Oceans. In January 2001, there were 553 capesizes in service in the world. Ocean Carriers' vessels were mostly chartered on a "time charter" basis for a period such as one year, three years, or five years, although the spot charter market was used on occasion. The company that chartered the ship was called the "charterer. The charterer paid Ocean Carriers a daily hire rate for the entire length of the contract, determined what cargo the vessel carried, and controlled where the vessel loaded and unloaded. The company, in turn, supplied a seaworthy vessel that complied with international regulations and manned the vessel with a fully qualified and certified crew. Ship Operations Operations also included ensuring adequate supplies and stores were onboard, supplying lubricating oils, scheduling repairs, conducting overall maintenance of the vessel, and placing all insurances for the vessel. For a new ship coming on line in early 2003, operating costs were expected to initially average $4,000 per day, and to increase annually at a rate of 1% above inflation Charterers were not charged a daily rate for the time the vessel spent in maintenance and repair, although operating costs were still incurred. Initially, 8 days a year were scheduled for such work. The time allotted to maintenance and repairs increased to 12 days per year after five years of operation, and to 16 days a year for ships older than ten years. The company had a policy of not operating vessels older than 15 years. Every five years, international regulations mandated that a special survey be undertaken to ensure seaworthiness as defined by international regulations. By the fifteenth year, the maintenance required to comply with the special surveys was very costly. Exhibit 1 shows the capital expenditures anticipated in preparation for the special surveys. These outlays were considered capital expenditures, which would each be depreciated on a 13-35 Wed Apr 20 chegg.com The company had a policy of not operating vessels older than 15 years. Every five years, international regulations mandated that a special survey be undertaken to ensure seaworthiness as defined by international regulations. By the fifteenth year, the maintenance required to comply with the special surveys was very costly. Exhibit 1 shows the capital expenditures anticipated in preparation for the special surveys. These outlays were considered capital expenditures, which would each be depreciated on a straight-line basis over a 5-year period. To avoid the larger expenditures for older ships, the company planned to sell the vessel into the secondhand market, or "scrap" the vessel just before the third special survey. When scrapped, the vessel was demolished and its steel was sold to demolition yards. The company estimated the scrap value to be $5M at the end of the fifteenth year. Exhibit 1 Capital Expenditures Anticipated in Preparation for Special Surveys 2007 2022 2027 2012 $350,000 2017 $750,000 $300,000 $850,000 $1,250,000 Supply of Capesizes Daily hire rates were determined by supply and demand. The number of ships available equaled the number of vessels in service the previous year plus any new ships delivered minus any scrappings and sinkings. When the market demand for shipping capacity was high, owners would keep a vessel in operation as long as possible. Conversely, when market demand was low, scrapping rose. Supply was also affected by the increases in size and efficiency the newer ships offered. As ships got bigger, faster, and more fuel efficient, fewer ships were needed to carry the same amount of cargo. Moreover, there had been very few scrappings in recent years, and most of the capacity of the worldwide fleet of capesizes was fairly young, Exhibit 2 shows the capesize fleet by age category as of December 2000. Exhibit 3 shows the number of new capesize vessels by expected delivery date. Exhibit 2 Capesize fleet by age category as of December 2000 Exhibit 2 Capesize fleet by age category as of December 2000 13-35 Wed Apr 20 65% .chegg.com Exhibit 2 Capesize fleet by age category as of December 2000 0 25 17 Mons of Deadweight Tons 15 10 5 20 10 24 5 to 9 Years Unders Over 24 Year Sorowy 15 10 Year 10 10 14 Years On Order for 2001 Exhibit 3 Current order book for dry bulk capesizes by delivery date 2001 2003 2004 2002 33 Number of vessels 63 21 Source: Company documents Estimates of future orders for vessels were not entirely reliable, especially projections spanning more than two or three years in the future. If sentiment was optimistic on market conditions, more vessels would be added to the order book. If the market outlook was poor, then vessels would be cancelled or converted to other types of vessels. A capesize took approximately 10 months to build, but contracts were signed to secure a berth place approximately two years before delivery and over one year before steel cutting for the vessel. "Delivery" referred to when the vessel was complete and delivered from the shipyard to the owner. 13-35 Wed Apr 20 65% .chegg.com Estimates of future orders for vessels were not entirely reliable, especially projections spanning more than two or three years in the future. If sentiment was optimistic on market conditions, more vessels would be added to the order book. If the market outlook was poor, then vessels would be cancelled or converted to other types of vessels. A capesize took approximately 10 months to build, but contracts were signed to secure a berth place approximately two years before delivery and over one year before steel cutting for the vessel. "Delivery" referred to when the vessel was complete and delivered from the shipyard to the owner. Market conditions The demand for dry bulk capesizes was determined by the world economy, especially its basic industries. Over 85% of the cargo carried by capesizes was iron ore and coal. Production and demand for these products increased in a strong economy. Changes in trade patterns also affected the demand for capesizes. For example, if a Western European country decided to switch its supply of iron ore from the United States to Australia, the demand for capesizes would increase since the distance between Europe and Australia is greater than the distance between Western Europe and the United States. Spot charter rates tended to fluctuate more widely than time charter rates, ie, the highs were higher and the lows were lower in the spot market. Therefore, when the market was high, ship owners sought time charters to lock in the high rates for as long a period as possible while the charterers preferred to trade in the spot market to avoid having to pay high daily rates any longer than necessary. Because Ocean Carriers vessels were relatively new and a bit larger than the industry average, they earned a premium to the market. For example, new ships generally earned a 15% premium in daily hire rates relative to the industry- wide average, while ships over 25 years old typically received a 35% discount from the industry average. Exhibit 4 shows average adjustments to daily hire rates for 3-year time charters based on the age of the ship. Exhibit 4 Daily hire rate adjustment factor for dry bulk capesizes based on age of vessel Over 24 years 20 to 24 years 15 to 19 years 10 to 14 years 5 to 9 years Under 5 years 0.65 0.75 0.80 1.00 1.05 1.15 13-35 Wed Apr 20 65% .chegg.com The average prevailing spot market rate at the time was $22,000 per day 1 With Australian production in iron ore expected to be strong and Indian iron ore exports expected to take off in the next few years, Linn took an optimistic view of the long-term market demand for capesizes. However, she also considered that 63 new vessels were scheduled for delivery in 2001 and that imports of iron ore and coal would probably remain stagnant over the next two years. Linn therefore anticipated that spot rates would fall in 2001 and 2002. In 2003, however, Linn was aware that Australian and Indian ore exports would begin, and that these new supplies would significantly increase trading volumes. Demand for capesizes would likely increase with these higher trading volumes, possibly boosting prices. Exhibit 5 provides data on some demand drivers, fleet size, and average daily hire rates over time. Exhibit 5 Worldwide iron ore vessel shipments, fleet size and average daily hire rates for capesize charters, 1994-2001 1994 1995 1996 1997 1998 1999 2000 2001E 375 397 385 424 420 410 440 436 NA NA NA 540 523 523 552 612 Iron ore vessel shipments Fleet size Avg. spot rate Avg. 3-yr charter rate $16,851 $20,149 $11,730 $14,794 $10,105 $9.427 $22,575 $18,250 $18,544 $14,079 $16,063 $13,076 $12,626 $15,344 Linn enlisted the services of a shipping-industry consulting firm to help her forecast daily hire rates for a new capesize. Worldwide iron ore vessel shipments and charter rates had been very strongly associated historically. The consulting group felt that this relation would continue to hold in the future, and based its forecast of charter rates off of long-term forecasts for worldwide iron ore vessel shipments. The long-term forecast for worldwide iron ore vessel shipments was for 2% annual growth during 2002 to 2005, and then dropping to 1.5% thereafter. Exhibit 6 shows the forecast of daily hire rates that was prepared for Linn. 13-35 Wed Apr 20 65% chegg.com Exhibit6 Forecasted Daily Time Charter Rates for New Capesire Vessel Age of Event Year Calendar Ship Year Ang Daily Growth Charter Rate Adjustment Adjusted Factor for Hire Daily Hire Rate Rate Expected Daily Rate 0 1 0. 15.344 14.747 215 -3.9% 45 Iron One Growth Shipments Millions of Tom 440 73 430 20% 454 20% 463 2.0% 472 20% 479 1.54 486 1.5% 493 1.5% 501 13 SOR 1.84 15.072 3 15.400 15.742 16.000 16.273 3 . 7 8 9 10 11 12 13 2.2% 2.25 22 12 124 1.25 12 12 1.21 20,000 20.200 20,400 18.714 17283 17,481 17.682 17.00 16.650 16,641 17.03 17.231 510 2000 2001 2002 2003 2004 2005 2000 2007 2008 2009 2010 2011 2012 2013 2014 2015 2016 2017 2010 2019 2000 2021 2022 2003 2004 2005 124 12 7 8 9 10 11 12 13 14 15 10 17 18 19 20 21 22 23 24 1.24 15 16 17 18 19 20 21 1.5% 532 15 540 1.5% 548 1.5% 558 1.5% 564 15% 57a 1.8% 501 500 1.54 590 154 608 1.5% 817 826 18 1.54 845 865 1.5% 1.15 1.15 1.15 1.15 1.05 105 105 105 1.05 1.00 1.00 1.00 1 00 100 0.80 0.00 0.80 0.80 0.80 0.75 0.75 0.75 0.75 0.75 0.85 1.24 1.24 125 17,719 18,103 18.501 18.714 17.283 17,481 17,662 17.30 18.092 17,428 17,428 17801 18.000 18.243 14,762 14,832 15.104 15.278 15,454 14,654 14,823 14.99 15.166 15.11 17,629 17.632 18,037 18.245 18.454 18.667 18,681 18.000 19.318 19.540 19.785 18.00 15 1.24 17,428 17.628 17,831 18.000 18,243 14,784 14,902 15.104 15.278 15.454 1485 14,123 14.900 15.166 15.341 13.448 126 12% RENRX 23 24 25 12 12% 1.25 27 2027 20,000 Some Company documents Newbuilding The charterer currently in negotiations with Ocean Carriers for a three-year time charter starting in 2003 had offered a rate of $20,000 per day with an annual escalation of $200 per day. The expected rate of inflation was 3%. The vessels in Ocean Carriers' current fleet could not be committed to a time charter beginning in 2003 because the ships were either already leased during that period or were too small to meet the customer's needs. Moreover, there were no sufficiently large capesizes available in the second-hand market. Ocean Carriers had to decide immediately if it should commission a new 180,000 deadweight ton ship for delivery in early 2003. The ship would cost $39 million, with 100% of the purchase price payable immediately and 13:35 Wed Apr 20 - chegg.com The vessels in Ocean Carriers' current fleet could not be committed to a time charter beginning in 2003 because the ships were either already leased during that period or were too small to meet the customer's needs. Moreover, there were no sufficiently large capesizes available in the second-hand market. Ocean Carriers had to decide immediately if it should commission a new 180,000 deadweight ton ship for delivery in early 2003. The ship would cost $39 million, with 10% of the purchase price payable immediately and 10% due in a year's time. The balance would be due on delivery. A new ship would be depreciated on a straight-line basis over 25 years. In addition, Linn expected to make a $500,000 initial investment in net working capital, which she anticipated would grow with inflation. Linn was also confident that the charterer would honor his proposed contract with Ocean Carriers if the company agreed to the terms. While there is always a risk that the charterer would stop paying before the end of the contract or terminate the contract early, Linn considered that the risk was small. Ocean Carriers had long established relationships with its charterers and only contracted with reputable charterers. The proposed contract, though, was only for three years, and it was Linn's responsibility to decide if future market conditions warranted the considerable investment in a new ship. Ocean Carriers uses a 9% discount rate. Quantitative Questions 1. What is the free cash flow for the first year that the ship is in operation (end of 2003)? 2. What is the change in NWC for the first and second years that the ship is operated? 3. What is the change in NWC for the last year and second to last year that the ship is operated? 4. Show how the first survey, which occurs in 2007, affects the FCFs (on a timeline) over the period from 2007 to 2011. 5. Suppose that a U.S. firm is subject to a 35% taxation rate and assume that Ocean Carriers operates their ships for the entirety of the ship's useful life. Find the NPV of the project. Should the ship be purchased? 6. Now suppose that Ocean Carriers is located in Hong Kong, where ships are not required to pay any tax on profits made overseas and are also exempted from paying any tax on profit made on cargo uplifted from Hong Kong. What is the value of the FCF for the first year the ship is in operation (end of 2003)