Answered step by step
Verified Expert Solution
Link Copied!

Question

1 Approved Answer

OCN London Question 2 The table gives the approximate distribution of results in Maths and English for some students. Students Maths English 72.8% 86% 56.6%
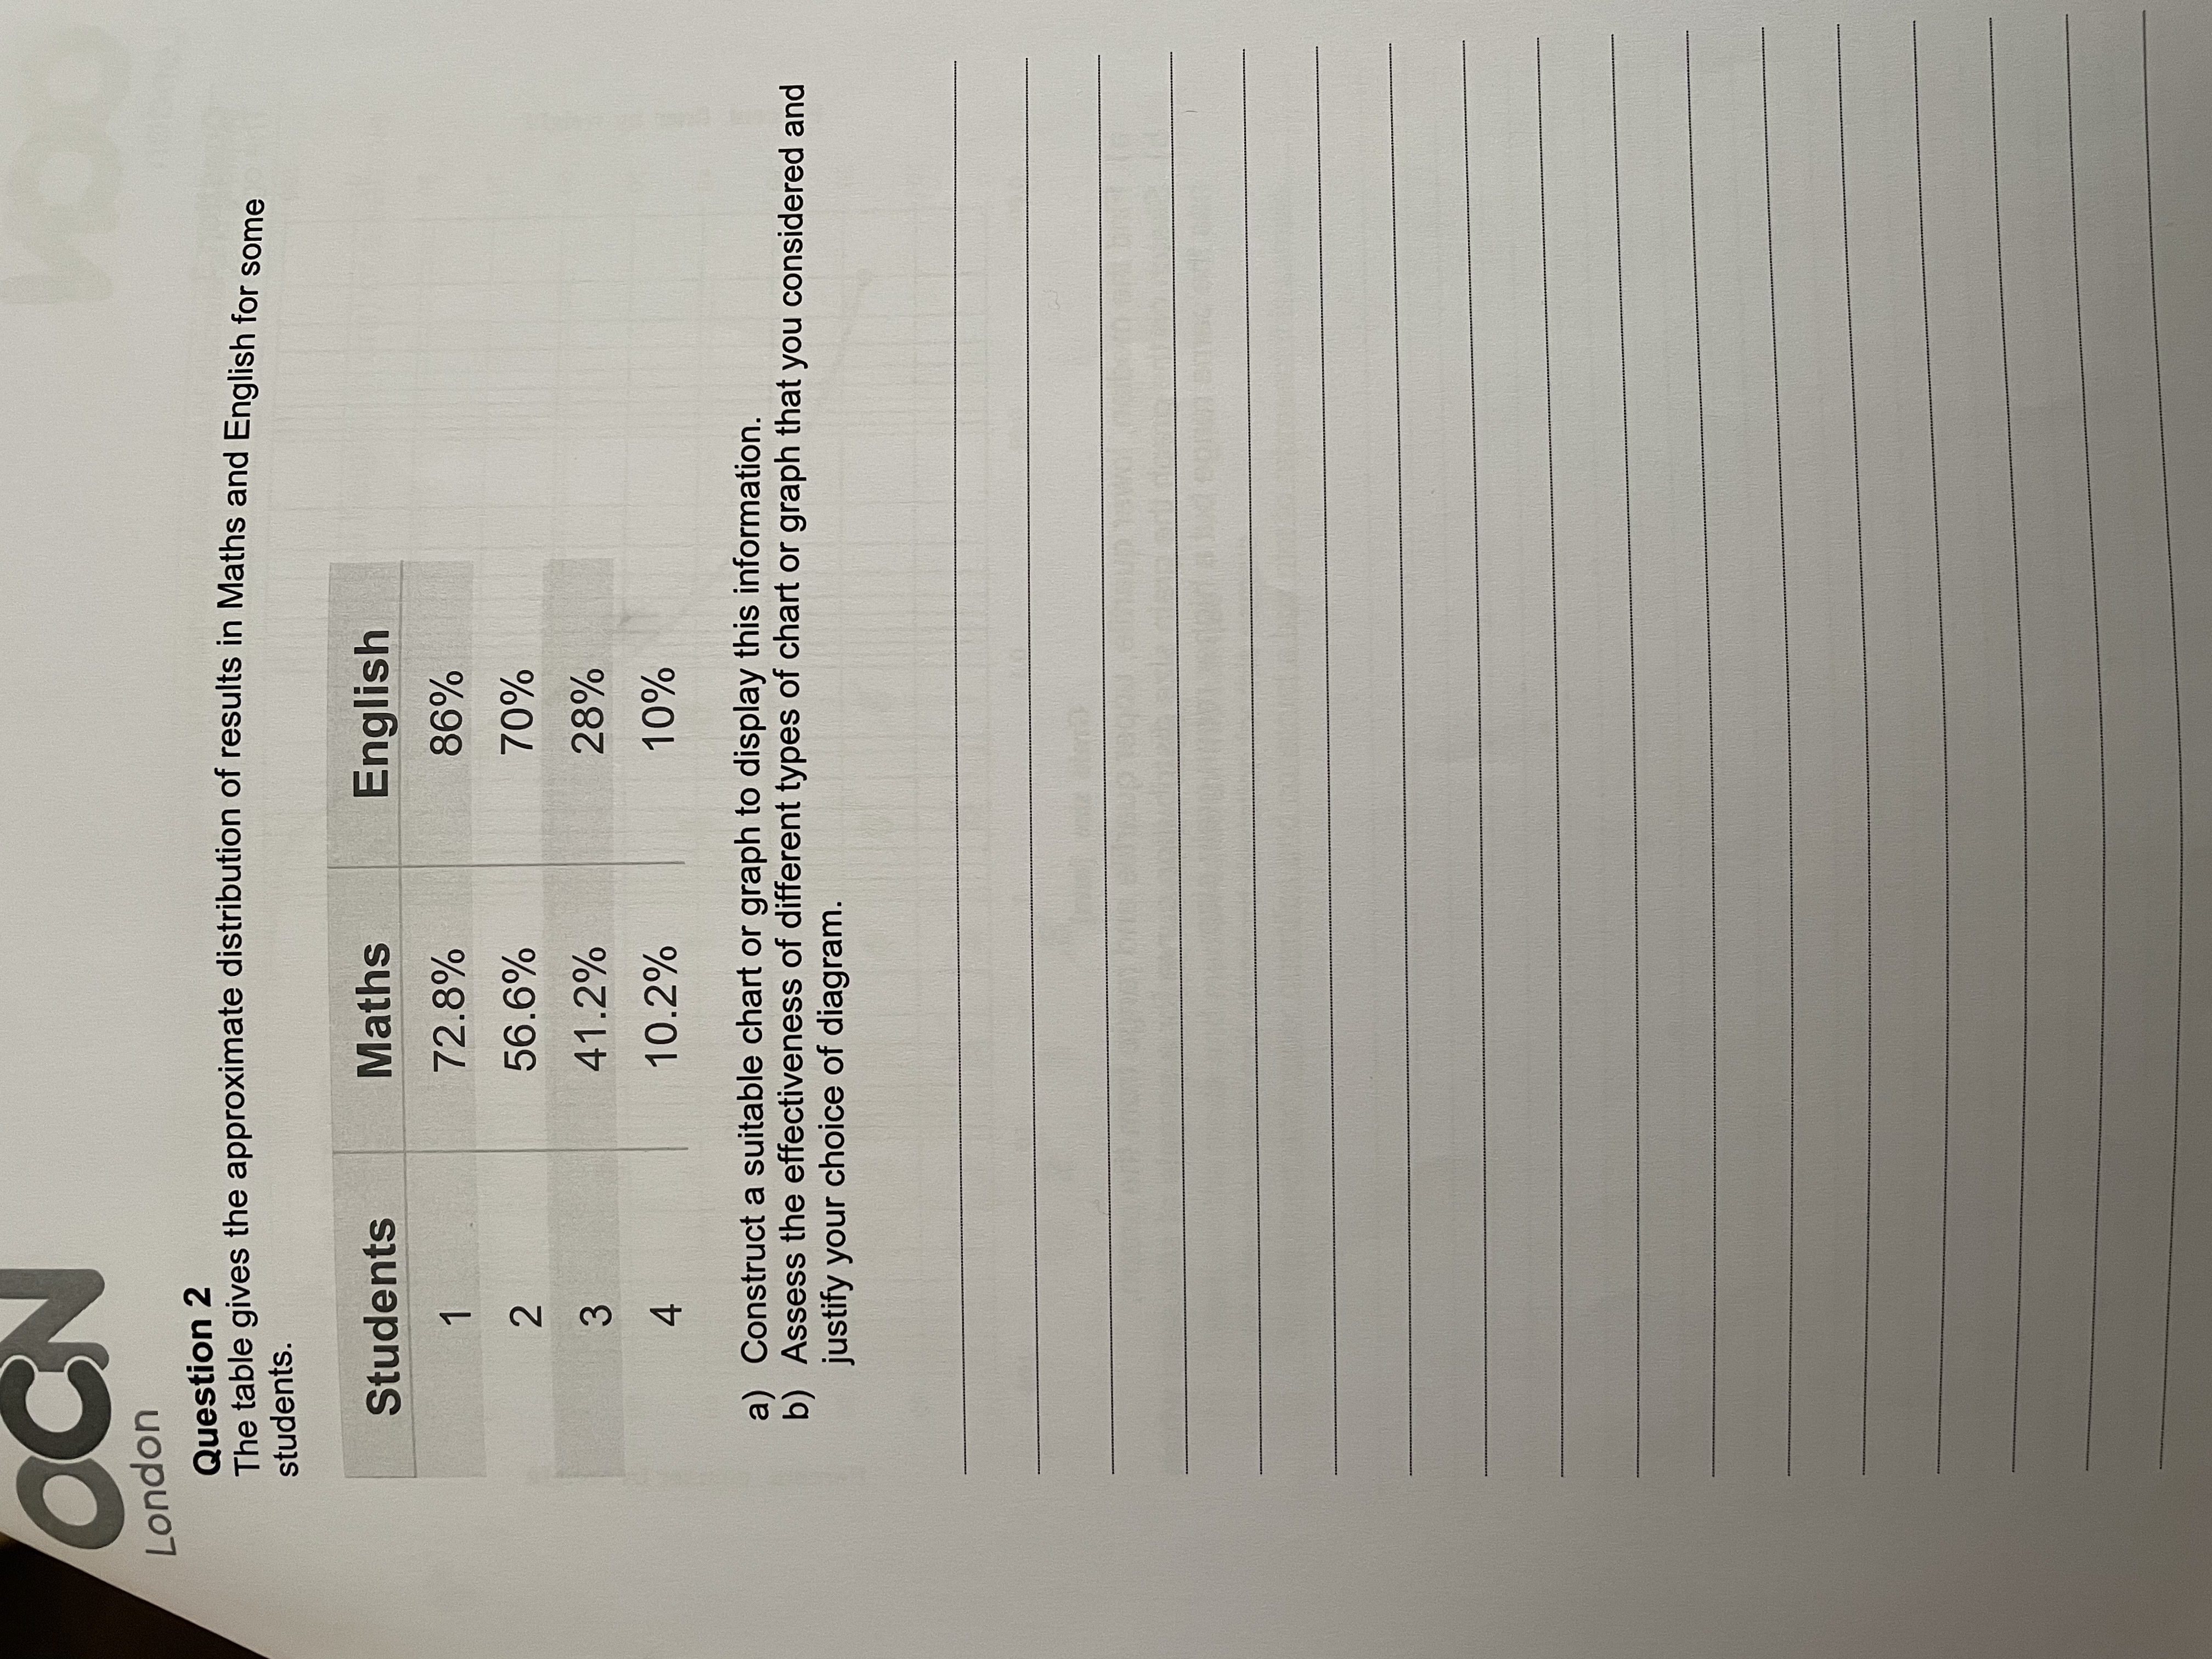
image text in transcribed
OCN London Question 2 The table gives the approximate distribution of results in Maths and English for some students. Students Maths English 72.8% 86% 56.6% 70% W N 41.2% 28% 4 10.2% 10% a) Construct a suitable chart or graph to display this information. b) Assess the effectiveness of different types of chart or graph that you considered and justify your choice of diagram

Step by Step Solution

There are 3 Steps involved in it

Step: 1

blur-text-image

Get Instant Access to Expert-Tailored Solutions

See step-by-step solutions with expert insights and AI powered tools for academic success

Step: 2

blur-text-image

Step: 3

blur-text-image

Ace Your Homework with AI

Get the answers you need in no time with our AI-driven, step-by-step assistance

Get Started

Recommended Textbook for

Trigonometry, Enhanced

Authors: Cynthia Y Young

4th Edition

1119321131, 9781119321132

More Books

Students also viewed these Mathematics questions

Question

define the term outplacement

Answered: 1 week ago

Question

describe the services that an outplacement consultancy may provide.

Answered: 1 week ago