Answered step by step
Verified Expert Solution
Question
1 Approved Answer
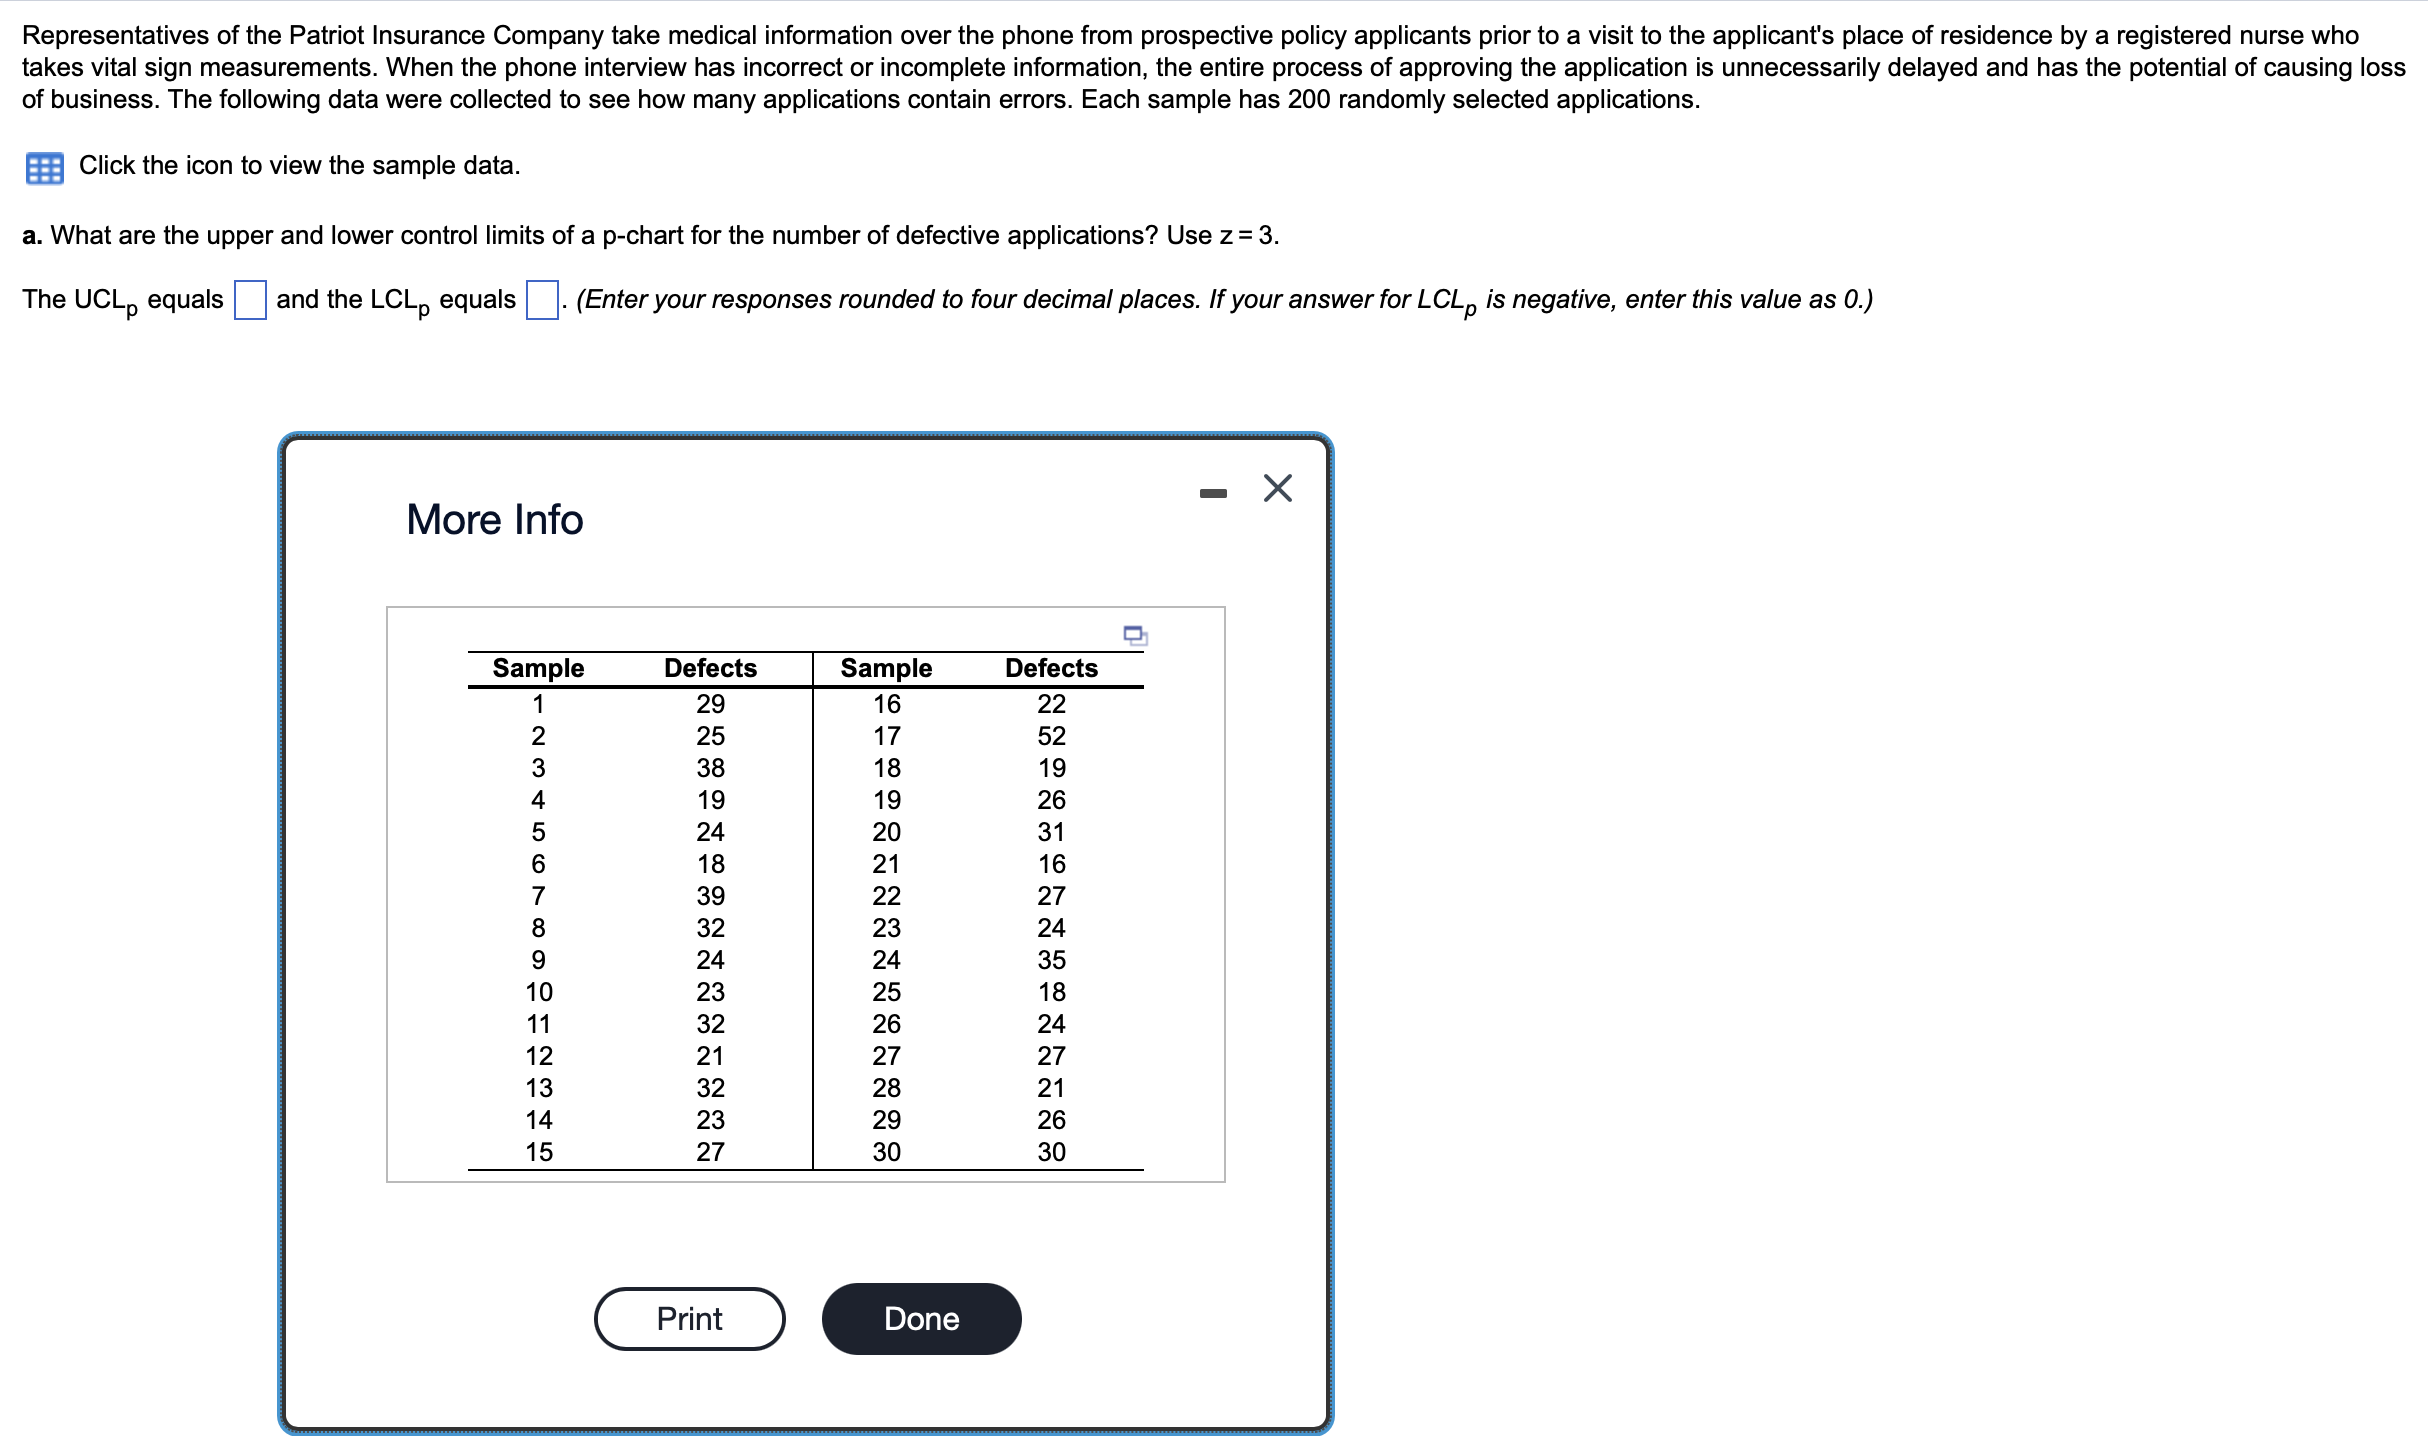
of business. The following data were collected to see how many applications contain errors. Each sample has 200 randomly selected applications. Click the icon to

 of business. The following data were collected to see how many applications contain errors. Each sample has 200 randomly selected applications. Click the icon to view the sample data. a. What are the upper and lower control limits of a p-chart for the number of defective applications? Use z=3. The UCLp equals and the LCLp equals (Enter your responses rounded to four decimal places. If your answer for LCLp is negative, enter this value as 0. ) More Info b. Is the process in statistical control? Since ther statistical the process is considered to be of business. The following data were collected to see how many applications contain errors. Each sample has 200 randomly selected applications. Click the icon to view the sample data. a. What are the upper and lower control limits of a p-chart for the number of defective applications? Use z=3. The UCLp equals and the LCLp equals (Enter your responses rounded to four decimal places. If your answer for LCLp is negative, enter this value as 0. ) More Info b. Is the process in statistical control? Since ther statistical the process is considered to be
 Step by Step Solution
There are 3 Steps involved in it
Step: 1

Get Instant Access to Expert-Tailored Solutions
See step-by-step solutions with expert insights and AI powered tools for academic success
Step: 2

Step: 3

Ace Your Homework with AI
Get the answers you need in no time with our AI-driven, step-by-step assistance
Get Started


