Often multivariable observations may not be detected as outliers when each variable is considered independently. In such situations outlier detection can only be successfully done when multivariate analysis is performed, and the interactions among different variables examined. With the aid of a diagrammatic illustration, given an example of how an outlier in a bivariate distribution may be confused as an inlier if each dimension of the bivariate distribution is treated as a distinct univariate distribution.
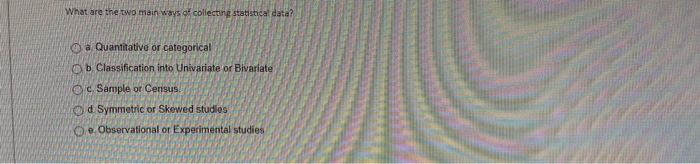
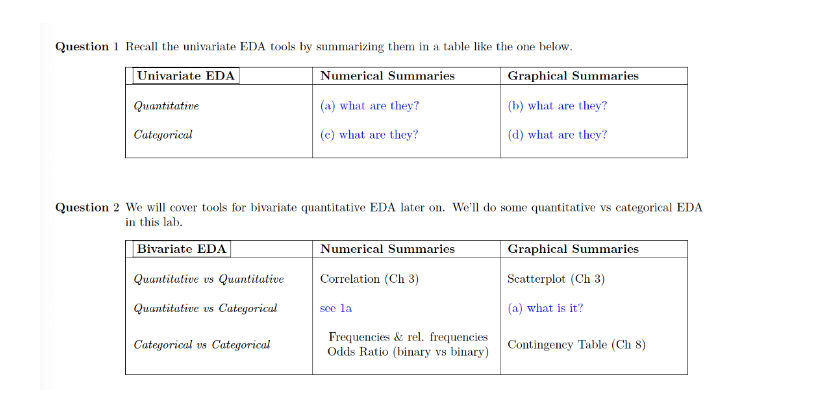
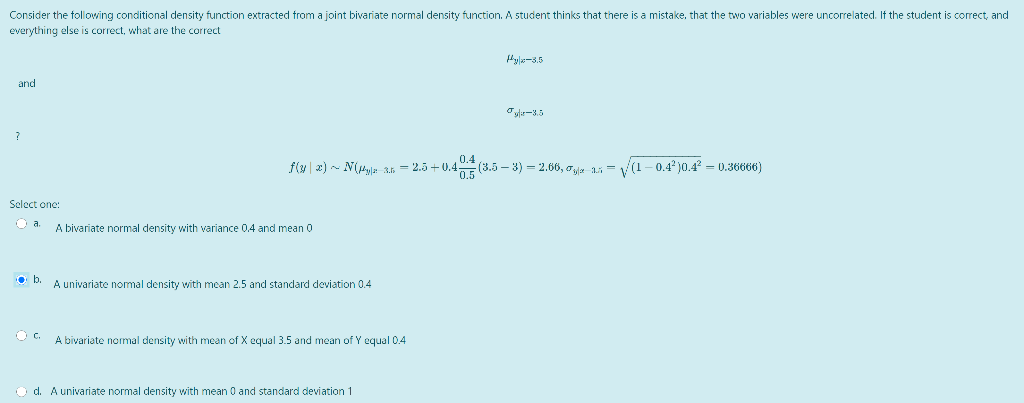
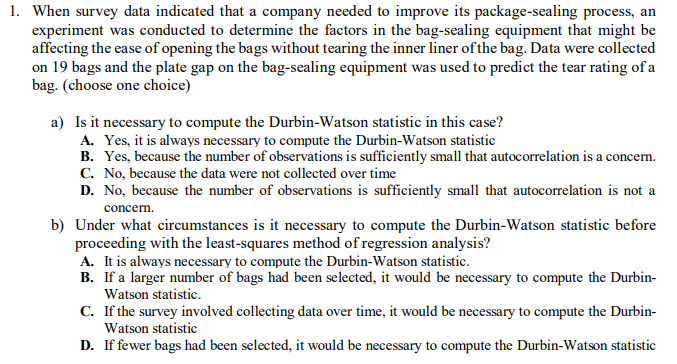
What are the two main way llecting statistical dat al Quantitative or categorical b. Classification into Univariate or Bivariate c. Sample or Census Od. Symmetric or Skewed studies Q)e Observational or Experimental studiesQuestion 1 Recall the univariate EDA tools by summarizing them in a table like the one below. Univariate EDA Numerical Summaries Graphical Summaries Quantitative (a) what are they? (b) what are they? Categorical (c) what are they? (d) what are they? Question 2 We will cover tools for bivariate quantitative EDA later on. We'll do some quantitative vs categorical EDA in this lab. Bivariate EDA Numerical Summaries Graphical Summaries Quantitative us Quantitative Correlation (Ch 3) Scatterplot (Ch 3) Quantitative us Categorical soe la (a) what is it? Categorical us Categorical Frequencies & rel. frequencies Odds Ratio (binary vs binary) Contingency Table (Ch 8)Consider the following conditional density function extracted from a joint bivariate normal density function. A student thinks that there is a mistake, that the two variables were uncorrelated. It the student is correct, and everything else is correct, what are the correct Hyla-3.5 and f(y | x) ~ NUbe an = 25+0.42 TE (3.5 - 3) = 2.60, Jax an = (1 -0.4')0.4" = 0.36660) Select one: A bivariate normal density with variance 0.4 and mean Q b. A univariate normal density with mean 2.5 and standard deviation 0.4 " A bivariate normal density with mean of X equal 3.5 and mean of Y equal 0.4 d. A univariate normal density with mean 0 and standard deviation 11. When survey data indicated that a company needed to improve its package-sealing process, an experiment was conducted to determine the factors in the bag-sealing equipment that might be affecting the ease of opening the bags without tearing the inner liner of the bag. Data were collected on 19 bags and the plate gap on the bag-sealing equipment was used to predict the tear rating of a bag. (choose one choice) a) Is it necessary to compute the Durbin-Watson statistic in this case? A. Yes, it is always necessary to compute the Durbin-Watson statistic B. Yes, because the number of observations is sufficiently small that autocorrelation is a concern. C. No, because the data were not collected over time D. No, because the number of observations is sufficiently small that autocorrelation is not a concern. b) Under what circumstances is it necessary to compute the Durbin-Watson statistic before proceeding with the least-squares method of regression analysis? A. It is always necessary to compute the Durbin-Watson statistic. B. If a larger number of bags had been selected, it would be necessary to compute the Durbin- Watson statistic. C. If the survey involved collecting data over time, it would be necessary to compute the Durbin- Watson statistic D. If fewer bags had been selected, it would be necessary to compute the Durbin-Watson statistic