Answered step by step
Verified Expert Solution
Question
1 Approved Answer
ographic un *2. A very simple version of the normative model described in the text involves a simple economic growth process converging to a


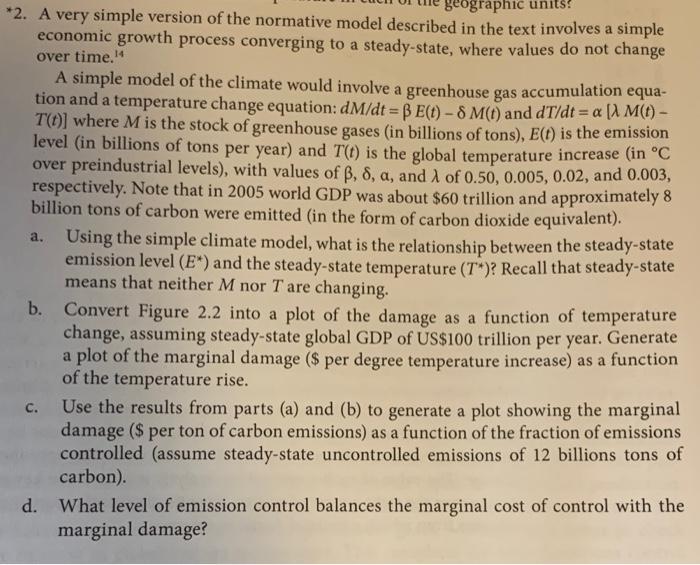
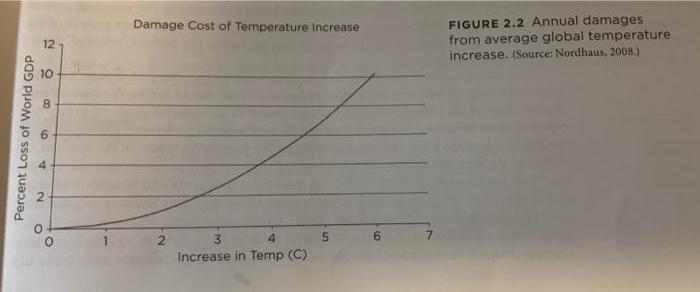
ographic un *2. A very simple version of the normative model described in the text involves a simple economic growth process converging to a steady-state, where values do not change over time. 14 A simple model of the climate would involve a greenhouse gas accumulation equa- tion and a temperature change equation: dM/dt = E(t) - 8 M(t) and dT/dt =a [ M(t) - T(t)] where M is the stock of greenhouse gases (in billions of tons), E(t) is the emission level (in billions of tons per year) and T(t) is the global temperature increase (in C over preindustrial levels), with values of , 8, a, and A of 0.50, 0.005, 0.02, and 0.003, respectively. Note that in 2005 world GDP was about $60 trillion and approximately 8 billion tons of carbon were emitted (in the form of carbon dioxide equivalent). a. Using the simple climate model, what is the relationship between the steady-state emission level (E*) and the steady-state temperature (T)? Recall that steady-state means that neither M nor T are changing. b. Convert Figure 2.2 into a plot of the damage as a function of temperature change, assuming steady-state global GDP of US$100 trillion per year. Generate a plot of the marginal damage ($ per degree temperature increase) as a function of the temperature rise. c. Use the results from parts (a) and (b) to generate a plot showing the marginal damage ($ per ton of carbon emissions) as a function of the fraction of emissions controlled (assume steady-state uncontrolled emissions of 12 billions tons of carbon). d. What level of emission control balances the marginal cost of control with the marginal damage? 12 CO Percent Loss of World GDP 09 N 09 4 Damage Cost of Temperature increase 2 3 4 Increase in Temp (C) 5 10 FIGURE 2.2 Annual damages from average global temperature increase. (Source: Nordhaus, 2008.)
Step by Step Solution
★★★★★
3.45 Rating (152 Votes )
There are 3 Steps involved in it
Step: 1
a In the simple climate model provided the relationship between the steadystate emission level E and ...
Get Instant Access to Expert-Tailored Solutions
See step-by-step solutions with expert insights and AI powered tools for academic success
Step: 2

Step: 3

Ace Your Homework with AI
Get the answers you need in no time with our AI-driven, step-by-step assistance
Get Started


