Answered step by step
Verified Expert Solution
Question
1 Approved Answer
Old Dominion Energys pipeline network between its natural gas depots allows it to transport gas between eleven different storage facilities for use in power generation.
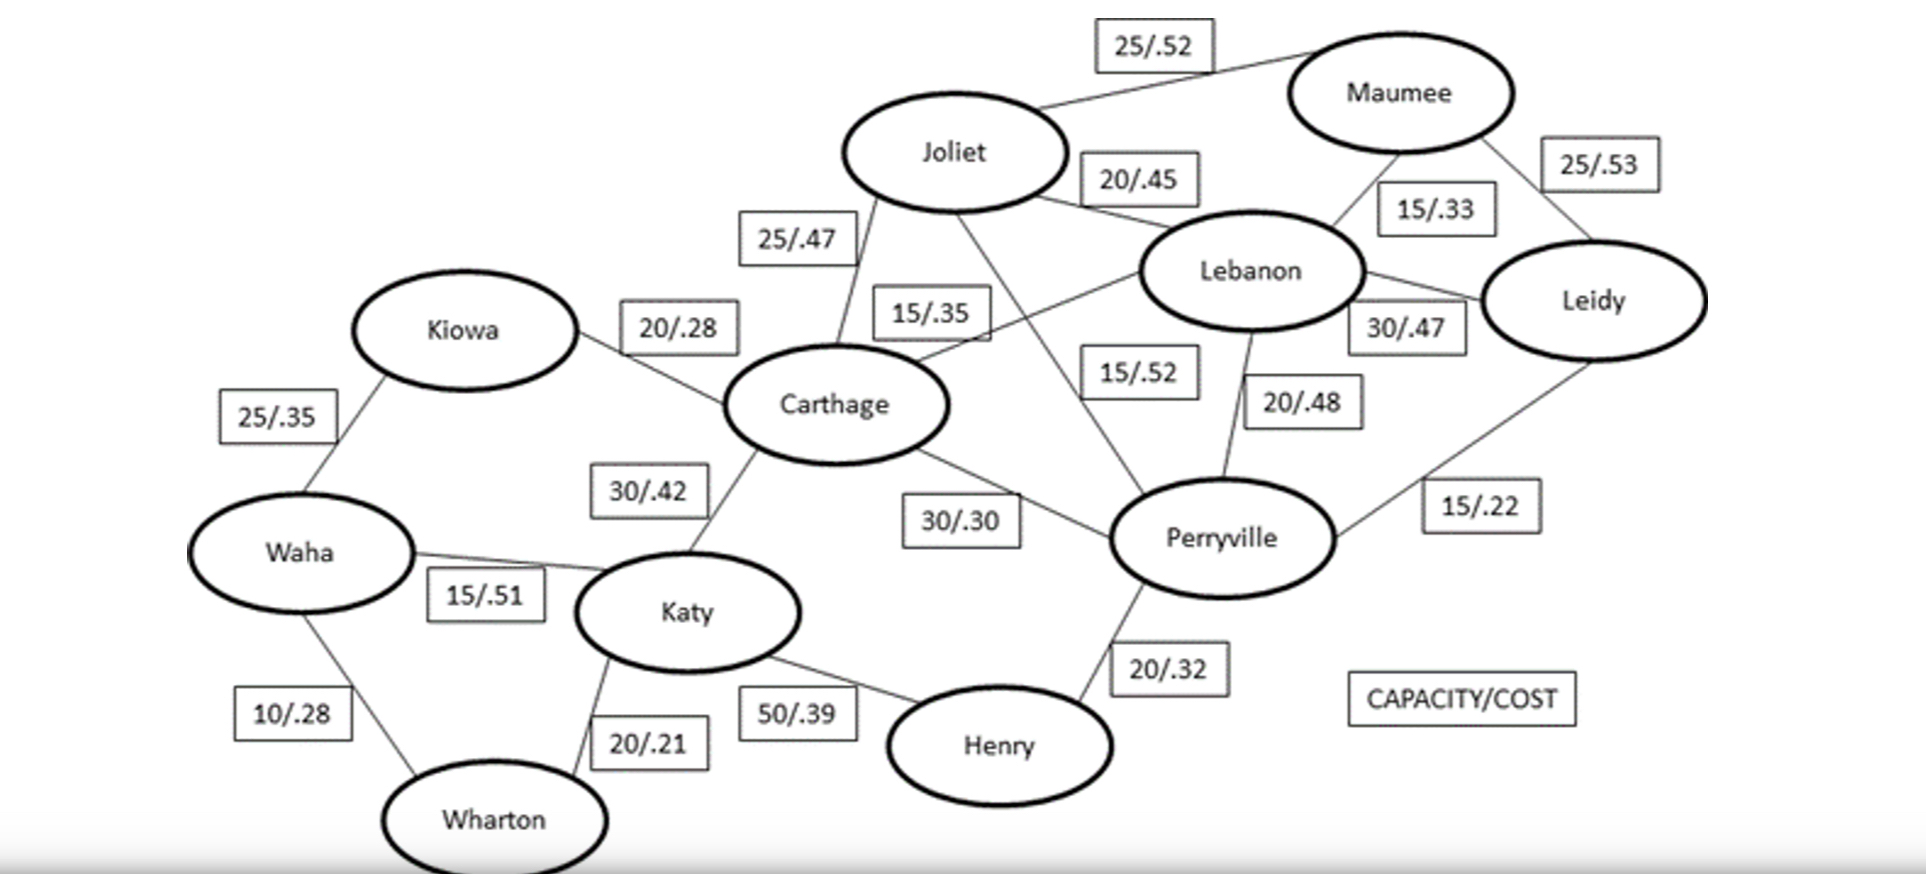
Old Dominion Energys pipeline network between its natural gas depots allows it to transport gas between eleven different storage facilities for use in power generation. Flow among the pipes is bidirectional. The transmission capacities of the pipes range from cubic feet per day to cubic feet per day. These are costs associated with shipping LNG along the pipelines, where the costs range from $ per cubic feet to $ per cubic feet.When ODE has a need for LNG at one of their locations, they look for excess capacity at their other locations, and then must determine if it is economical to meet the demand by shipping along their pipeline system. This is based on what the receiving locations are willing to pay per cubic feet and what the costs will be to ship through the pipeline system.If it is economical to ship the gas, then the optimal path may be determined in order to maximize profit.Figure shows the pipeline system, with the pipeline capacities X cubic feet and the costs in dollars per cubic feet to transport gas along the pipelines.HINT: You may want to start by building pipeline capacity and transportation cost data tables into a spreadsheet for use in your profit optimization model.HINT: It may be useful to model nonexistent pipelines as having capacity Figure ODE LNG Network with Capacities and CostsREQUIREMENT: Build an Excel Dashboard that ODE can use to determine whether or not they should meet a demand with their own pipeline system and unused capacity, and what set of pipes and stations they should use to transport the gas. The Dashboard should have the following characteristics: Gas demands should be entered for each station in cu ft Excess capacity should be entered for each station in cu ft The price each station is willing to pay should be entered in $cuft The Dashboard should include instructions for implementing the Excel Solver to obtain a solution The output should include the profit achieved by transporting the gas The output should include the pipelines used and amounts to be transported along each pipeline The output should include any unmet demand.Use the dashboard to solve the following scenario:ODE currently has cf of gas in storage at Katy. Customers in Joliet are willing to pay $ per thousand cf for up to cf of gas, and customers in Leidy are offering $ per thousand cf for up to cf of gas. Ensure the model can be used to analyze other scenarios by changing the values of excess supply, demand, and payment and then rerunning the optimizer

Step by Step Solution
There are 3 Steps involved in it
Step: 1

Get Instant Access to Expert-Tailored Solutions
See step-by-step solutions with expert insights and AI powered tools for academic success
Step: 2

Step: 3

Ace Your Homework with AI
Get the answers you need in no time with our AI-driven, step-by-step assistance
Get Started


