

Question
Old MathJax webview - Austal Limited (ASX code: ASB) - Synlait Milk Limited (ASX code: SM1) For each company, the displayed page summarises general information
Old MathJax webview
- Austal Limited (ASX code: ASB) - Synlait Milk Limited (ASX code: SM1) For each company, the displayed page summarises general information about the company including the sector and industry in which it operates, total market capitalisation of the firm, latest closing share price, etc. 2. Each firm operates in a different Industry Group. Austal Limited operates in the Capital Goods industry group. Synlait Milk Limited operates in the Food, Beverage, and Tobacco industry group. 3. On the left-hand side, click on Financial Data. The displayed page shows annual and interim information for your assigned companies (in the view bar, make sure you choose annual and not interim data). On the pages control bar at the top, you will see the first three icons which displays the companys summarised annual financial statements (income statement (profit & loss statement), balance sheet, etc). 4. The figures shown on the Financial Data page are rounded figures and are not to be used in the calculation of ratios. To access the raw figures for your ratio calculations, select the relevant time period (i.e., 2019 to 2020) from the year range drop down bars, and click on go. Once the figures appear, click on the download spreadsheet button. This will download an Excel file that contains all the relevant financial statements i.e., Profit & Loss Statement, Balance Sheet, etc. for both 2019 and 2020. 5. In the downloaded Excel file, you will see a sheet titled Revenue/Expense in which you can locate the Cost of goods sold (COGS) for each company for the different years. This is the figure you will employ as the Cost of Goods Sold for your ratio calculations. Note: For both companies in 2019, you are required to add up various COGS items to ascertain the total COGS for the year under investigation. However, you only need to add up various COGS items to ascertain the total COGS for one of the companies in 2020. Remember to disregard the minus sign in front of the total COGS figure and remove the minus sign prior to using the total COGS figure in your calculations. The minus sign denotes that COGS is an expense item. 6. For more detailed information about how to obtain the data required for your group assignment, please watch the How to Obtain Data for the Group Assignment video. The video is located in the Assessment Zone under the Assessment 2: Numerical Problem Solving link. Ideally, your group members should watch this video prior to commencing the assignment. 2 WHAT IS REQUIRED You are part of a team of financial analysts who have been hired by Eden Waldorf, Chief Loans Officer (CLO) at Bastion Banking Corporation. The bank has received loan applications from the abovementioned companies. Accordingly, the CLO of the bank requires your team to analyse the financial position and performance of the above assigned companies for the two stated financial years (2019 and 2020), to determine whether the companies are eligible for a loan from the bank. Your task involves answering the following 5 questions in your own words (i.e., do not simply cut and paste information from the Annual Report or any other source). You must apply critical thinking concepts when explaining and justifying your choices. NB: Ensure that you refer to the marking criteria prior to commencing the assignment. BASED ON THE INFORMATION AVAILABLE ON THE DatAnalysis Premium DATABASE FOR BOTH ASSIGNED COMPANIES, ANSWER ALL OF THE FOLLOWING QUESTIONS (1 TO 5 INCLUSIVE). QUESTION 1: Calculate the Cash Conversion Cycle (CCC) for each of the two companies in 2019 and 2020. Using your answer, analyse the efficiency of each of the two companies in managing their working capital in 2020 as compared to 2019. Note: ensure that you analyse in this question, not just describe the CCC values. (3 marks) QUESTION 2: Analyse the sources of finance for each of the two companies in 2020 as compared to 2019. Use two capital structure ratios to support your answer and provide an explanation regarding the changes in the composition of the sources of finance for each enterprise. Note: ensure that you analyse in this question, not just describe the ratio values. (2 marks) QUESTION 3: Analyse the ability of management to manage their fixed assets and total assets for each of the two companies in 2020 as compared to 2019. Use two Asset Management efficiency ratios to support your answer and explain any change in each companies ability to use their assets to generate sales. Note: ensure that you analyse in this question, not just describe the ratio values.
JUST ANSWER QUESTION 3 IF APPLICAPLE
Balance sheet of both companies between 2019 2020

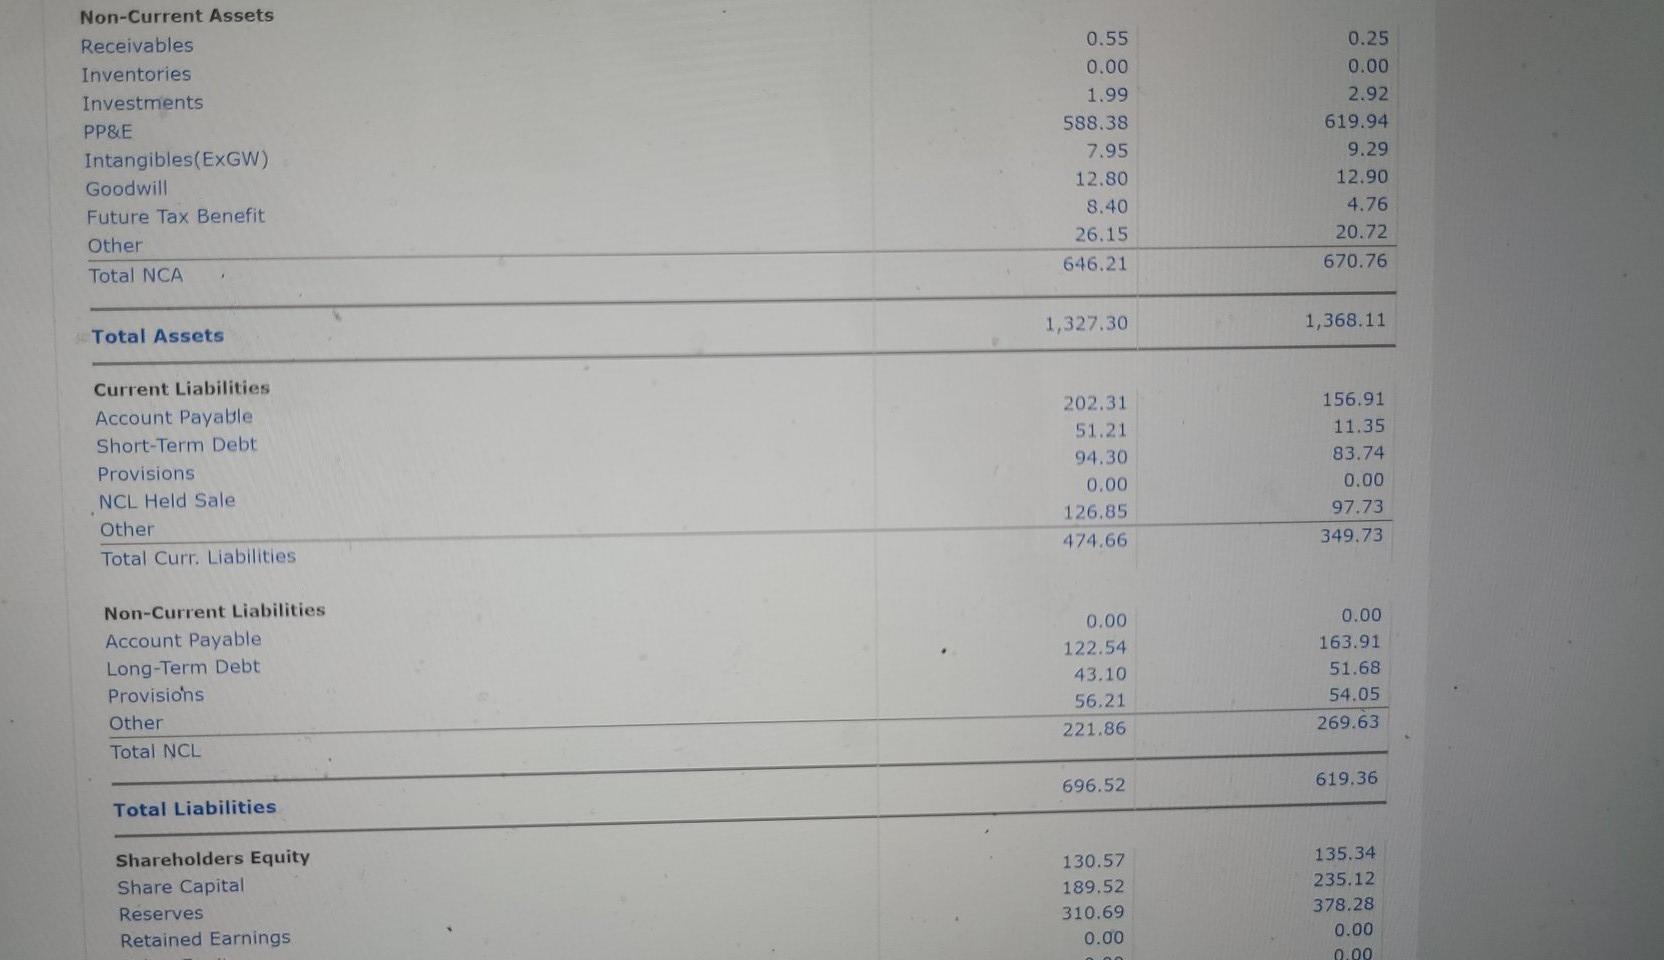
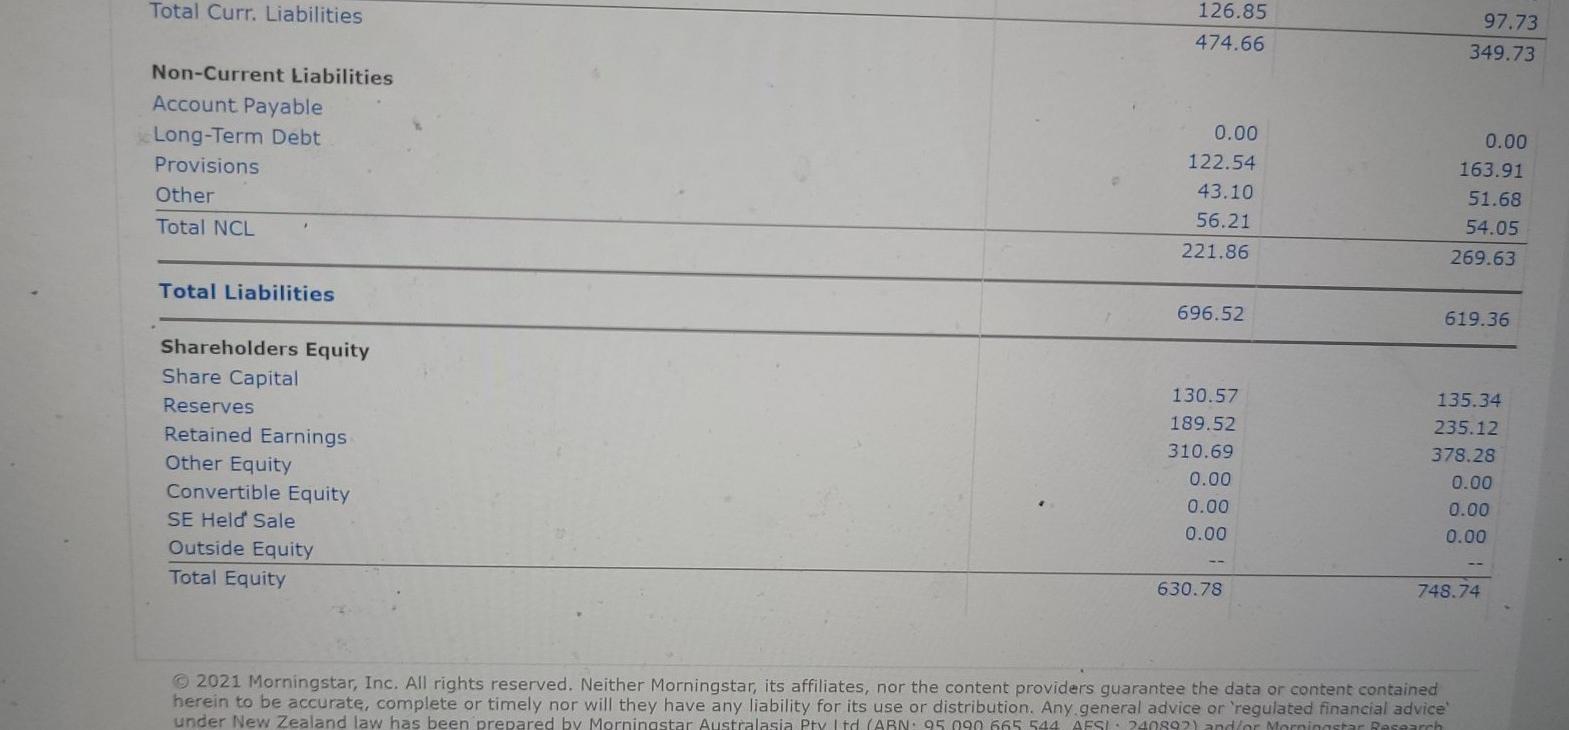
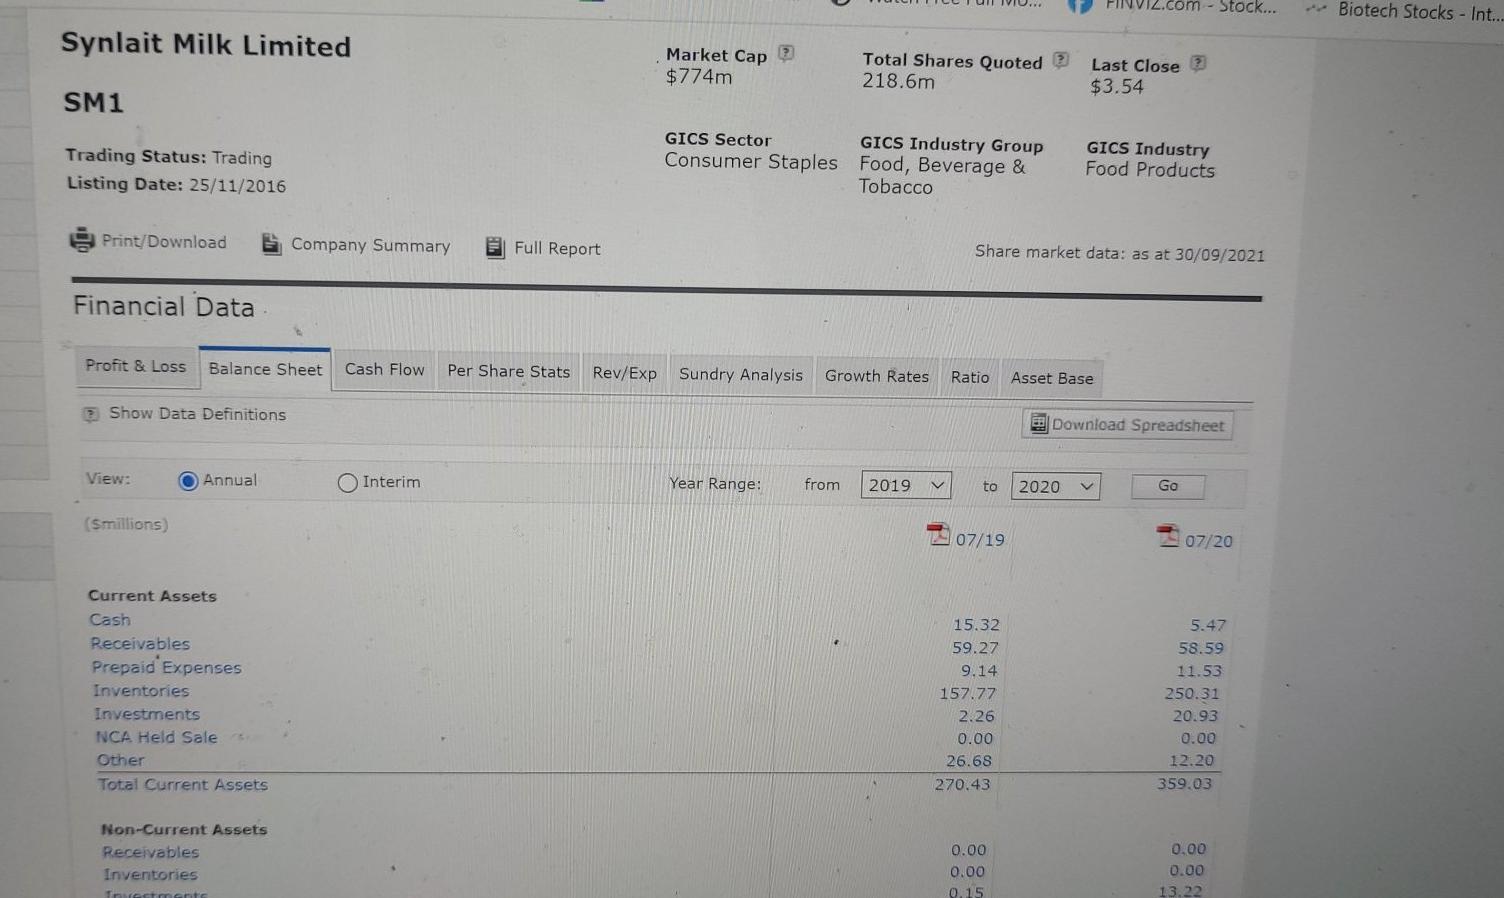


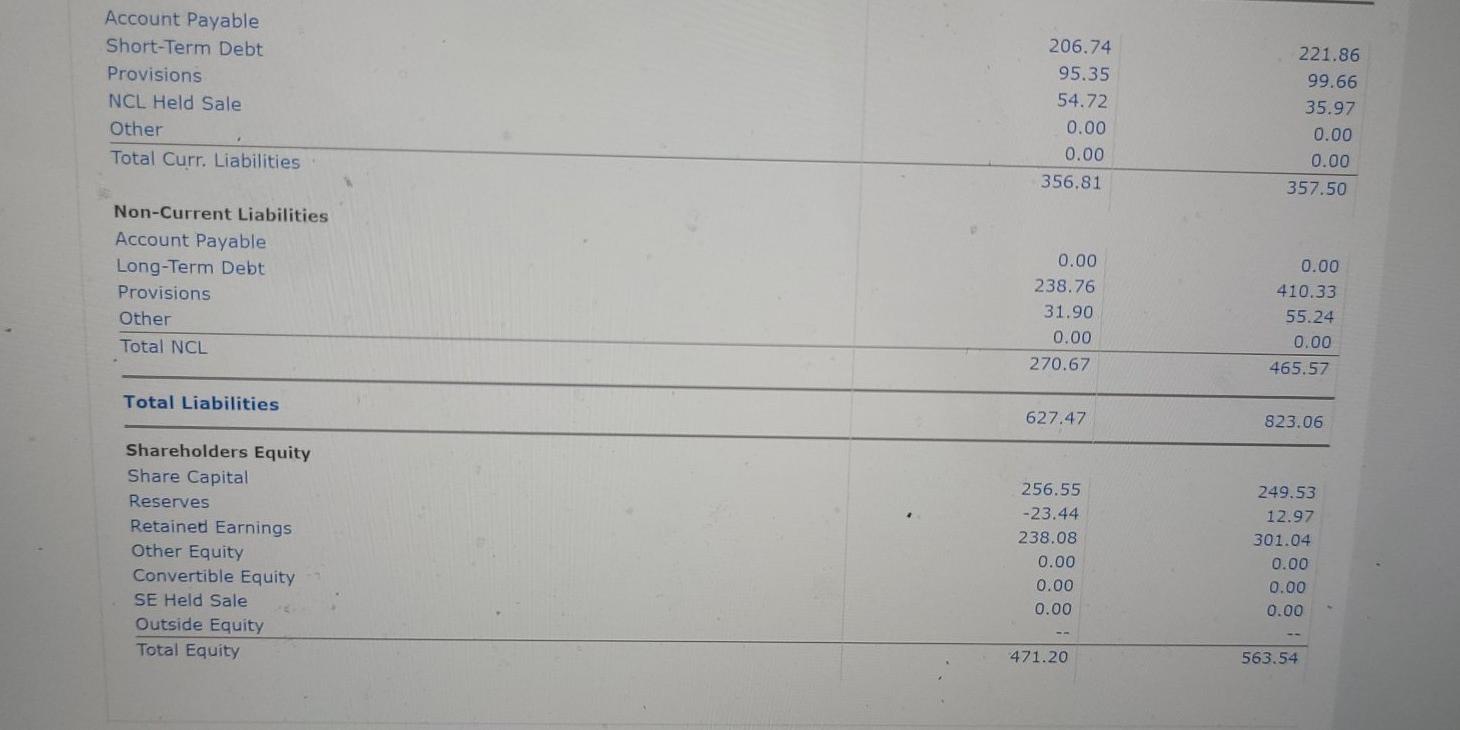
Austal Limited Watch Free Full Mo... FINVIZ.com - Stock... Biotech Stock Market Cap $576m Total Shares Quoted Last Close 359.6m $1.88 etails ASB Trading Status: Trading Listing Date: 08/12/1998 GICS Sector thustras GICS Industry Group Capital Goods GICS Industry Aerospace & Defense Print/Download Company Summary Share market data: as at 30/09/2021 Financial Data Profit & Loss Balance Sheet Cash flow ter an und Aalis drowth Rates Ratio Asset Base Show Data Definitions Uil Download Spreadsheet View Annual Inloom 2019 2020 Go (millions) 06/19 06/20 Current Assets Cash Receivables Prepaid. Expenses Inventories Investments NCA Held Sale Other Total Current Assets 275.66 225.27 9.48 167.04 1.93 0.00 1.70 681.09 396.67 144.22 11.44 143.80 1.22 0.00 0.00 697.34 Non-Current Assets Non-Current Assets Receivables Inventories Investments PP&E Intangibles(ExGW) Goodwill Future Tax Benefit Other Total NCA 0.55 0.00 1.99 588.38 7.95 12.80 8.40 26.15 646.21 0.25 0.00 2.92 619.94 9.29 12.90 4.76 20.72 670.76 1,327.30 1,368.11 Total Assets Current Liabilities Account Payable Short-Term Debt Provisions NCL Held Sale Other Total Curr. Liabilities 202.31 51.21 94.30 0.00 126.85 474.66 156.91 11.35 83.74 0.00 97.73 349.73 Non-Current Liabilities Account Payable Long-Term Debt Provisions Other Total NCL 0.00 122.54 43.10 56.21 221.86 0.00 163.91 51.68 54.05 269.63 696.52 619.36 Total Liabilities Shareholders Equity Share Capital Reserves Retained Earnings 130.57 189.52 310.69 0.00 135.34 235.12 378.28 0.00 0.00 Total Curr. Liabilities 126.85 474.66 97.73 349.73 Non-Current Liabilities Account Payable Long-Term Debt Provisions Other Total NCL 0.00 122.54 43.10 56.21 0.00 163.91 51.68 54.05 221.86 269.63 Total Liabilities 696.52 619.36 Shareholders Equity Share Capital Reserves Retained Earnings Other Equity Convertible Equity SE Held Sale Outside Equity Total Equity 130.57 189.52 310.69 0.00 0.00 0.00 135.34 235.12 378.28 0.00 0.00 0.00 630.78 748.74 2021 Morningstar, Inc. All rights reserved. Neither Morningstar, its affiliates, nor the content providers guarantee the data or content contained herein to be accurate, complete or timely nor will they have any liability for its use or distribution. Any general advice or 'regulated financial advice under New Zealand law has been prepared by Morningstar Australasia Pry itd. ABN: 95 090 665 544 AESI. 24089) andler Morninaster Research FINVIZ.com - Stock... -- Biotech Stocks - Int... Synlait Milk Limited Market Cap ? $774m Total Shares Quoted > 218.6m Last Close $3.54 SM1 Trading Status: Trading Listing Date: 25/11/2016 GICS Sector GICS Industry Group Consumer Staples Food, Beverage & Tobacco GICS Industry Food Products Print/Download Company Summary Full Report Share market data: as at 30/09/2021 Financial Data Profit & Loss Balance Sheet Cash Flow Per Share Stats Rev/Exp Sundry Analysis Growth Rates Ratio Asset Base Show Data Definitions Download Spreadsheet View: O Annual Interim Year Range: from 2019 V to 2020 Go (Smillions) 07/19 07/20 Current Assets Cash Receivables Prepaid Expenses Inventories Investments NCA Held Sale Other Total Current Assets 15.32 59.27 9.14 157.77 2.26 0.00 26.68 270.43 5.47 58.59 11.53 250.31 20.93 0.00 12.20 359.03 Non-Current Assets Receivables Inventories 0.00 0.00 0.00 0.00 13.22 0.15 Football LiveScore -... Watch Free Full Mo... FINVIZ.com - Stock... Biotech Sto Non-Current Assets Receivables Inventories Investments PP&E Intangibles(EXGW) Goodwill Future Tax Benefit Other Total NCA 0.00 0.00 0.15 808.88 15.72 3.49 0.00 0.00 828.24 0.00 0.00 13.22 913.96 39.49 60.90 0.00 0.00 1,027.57 Total Assets 1,098.67 1,386.61 Current Liabilities Account Payable Short-Term Debt Provisions NCL Held Sale Other Total Curr. Liabilities 206.74 95.35 54.72 0.00 0.00 356.81 221.86 99.66 35.97 0.00 0.00 357.50 Non-Current Liabilities Account Payable Long-Term Debt Provisions Other Total NCL 0.00 238.76 31.90 0.00 270.67 0.00 410.33 55.24 0.00 465.57 Total Liabilities 627.47 823.06 Shareholders Equity Share Capital Reserves Retained Earnings thor at 256.55 -23.44 238.08 249.53 12.97 2014 828.24 1,027.57 Total Assets 1,098.67 1,386.61 Current Liabilities Account Payable Short-Term Debt Provisions NCL Held Sale Other Total Curr. Liabilities 206.74 95.35 54.72 0.00 0.00 356.81 221.86 99.66 35.97 0.00 0.00 357.50 Non-Current Liabilities Account Payable Long-Term Debt Provisions Other Total NCL 0.00 238.76 31.90 0.00 270.67 0.00 410.33 55.24 0.00 465.57 Total Liabilities 627.47 823.06 Shareholders Equity Share Capital Reserves Retained Earnings Other Equity Convertible Equity SE Held Sale Outside Equity Total Equity 256.55 -23.44 238.08 0.00 0.00 0.00 249.53 12.97 301.04 0.00 0.00 0.00 471.20 563.54 Account Payable Short-Term Debt Provisions NCL Held Sale Other Total Curr. Liabilities 206.74 95.35 54.72 0.00 0.00 356.81 221.86 99.66 35.97 0.00 0.00 357.50 Non-Current Liabilities Account Payable Long-Term Debt Provisions Other Total NCL 0.00 238.76 31.90 0.00 270.67 0.00 410.33 55.24 0.00 465.57 Total Liabilities 627.47 823.06 Shareholders Equity Share Capital Reserves Retained Earnings Other Equity Convertible Equity SE Held Sale Outside Equity Total Equity 256.55 -23.44 238.08 0.00 0.00 0.00 249.53 12.97 301.04 0.00 0.00 0.00 471.20 563.54
Step by Step Solution
There are 3 Steps involved in it
Step: 1

Get Instant Access to Expert-Tailored Solutions
See step-by-step solutions with expert insights and AI powered tools for academic success
Step: 2

Step: 3
Ace Your Homework with AI
Get the answers you need in no time with our AI-driven, step-by-step assistance
Get Started
Case Studies In Strategic ManagementHow Executive Input Enables Students Development
Authors: Gunther Friedl, Andreas Biagosch
1st Edition
3319955543, 9783319955544