

Answered step by step
Verified Expert Solution
Question
1 Approved Answer
Old MathJax webview Formulas only. thanks (Excel Formulas) You are considering an investment in the stock market and have identified two potential stocks (OMG and
Old MathJax webview
Formulas only. thanks
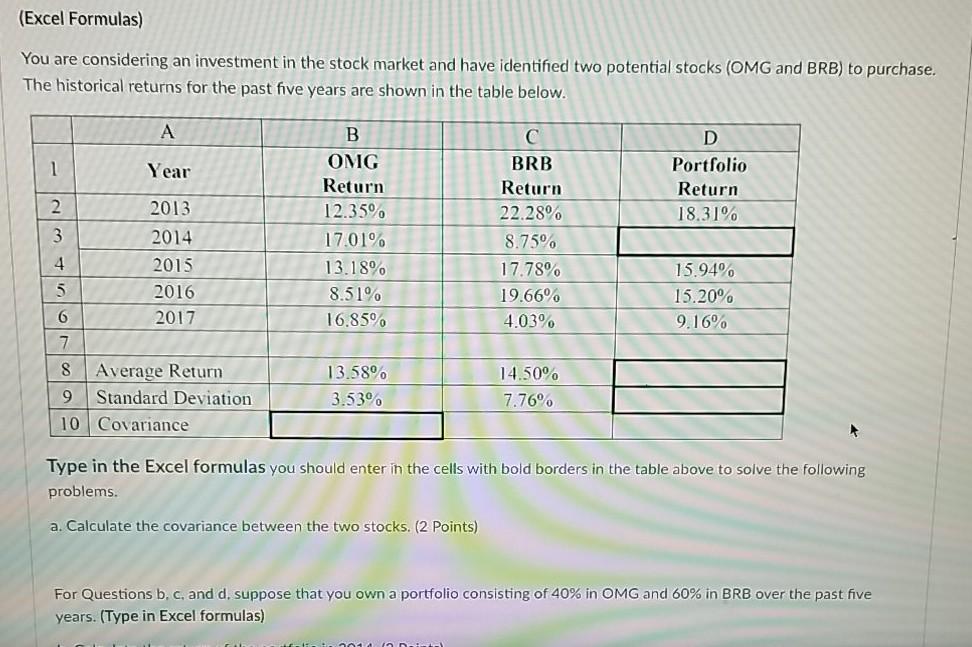
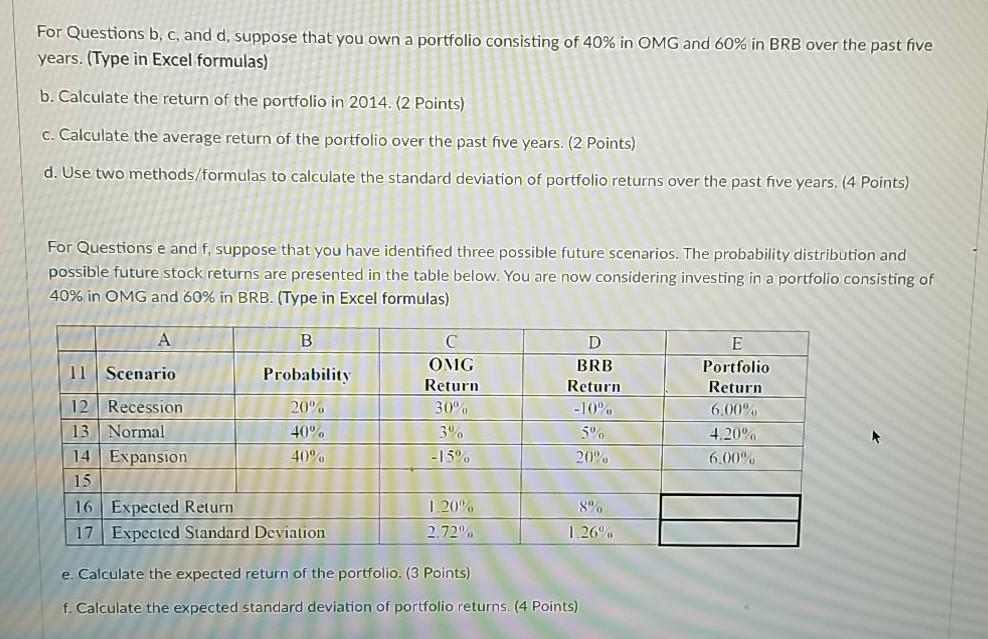
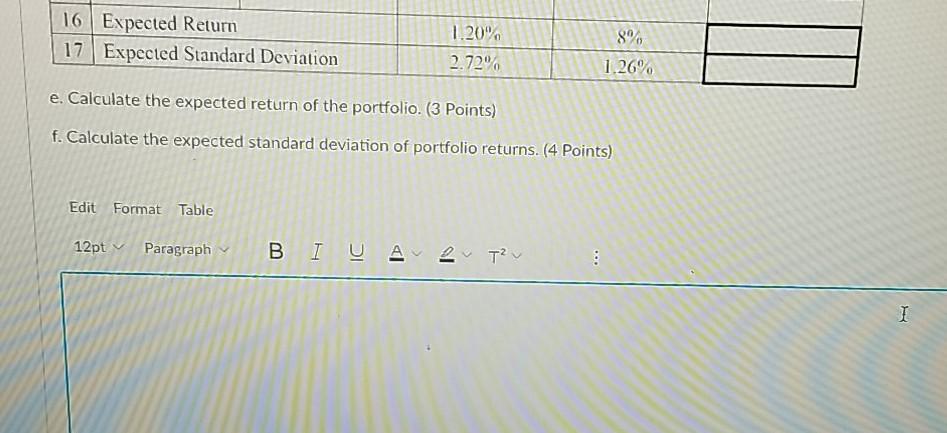
(Excel Formulas) You are considering an investment in the stock market and have identified two potential stocks (OMG and BRB) to purchase. The historical returns for the past five years are shown in the table below. A 1 Year D Portfolio Return 18.31% 2 2013 3 2014 B OMG Return 12.35% 17.01% 13.18% 8.51% 16.859 C BRB Return 22.28% 8.75% 17.78% 19.66% 4.03% 4 5 2015 2016 2017 15.94% 15.20 9.16% 6 7 8 Average Return 9 Standard Deviation 10 Covariance 13.58% 3.53% 14.50% 7.76% Type in the Excel formulas you should enter in the cells with bold borders in the table above to solve the following problems. a. Calculate the covariance between the two stocks. (2 Points) For Questions b, c, and d. suppose that you own a portfolio consisting of 40% in OMG and 60% in BRB over the past five years. (Type in Excel formulas) For Questions b, c, and d, suppose that you own a portfolio consisting of 40% in OMG and 60% in BRB over the past five years. (Type in Excel formulas) b. Calculate the return of the portfolio in 2014. (2 Points) C. Calculate the average return of the portfolio over the past five years. (2 Points) d. Use two methods/formulas to calculate the standard deviation of portfolio returns over the past five years. (4 Points) For Questions e and f, suppose that you have identified three possible future scenarios. The probability distribution and possible future stock returns are presented in the table below. You are now considering investing in a portfolio consisting of 40% in OMG and 60% in BRB. (Type in Excel formulas) A B 11 Scenario Probability C OMG Return 30% 3 -15% D BRB Return -10% 50. 20% E Portfolio Return 6.00 4.20% 6.00% 12 Recession 20%. 13 Normal 40. 14 Expansion 40% 15 16 Expected Return 17 Expected Standard Deviation 1.20% 2.72 S 1.26. e. Calculate the expected return of the portfolio. (3 Points) f. Calculate the expected standard deviation of portfolio returns. (4 Points) 16 Expected Return 17 Expected Standard Deviation 8% 1.20% 2.72 1.26% e. Calculate the expected return of the portfolio. (3 Points) f. Calculate the expected standard deviation of portfolio returns. (4 Points) Edit Format Table 12ptParagraph BI U Ave TvStep by Step Solution
There are 3 Steps involved in it
Step: 1

Get Instant Access to Expert-Tailored Solutions
See step-by-step solutions with expert insights and AI powered tools for academic success
Step: 2

Step: 3
Ace Your Homework with AI
Get the answers you need in no time with our AI-driven, step-by-step assistance
Get Started
Lombard Street A Description Of The Money Market
Authors: Walter Bagehot
1st Edition
1504017293