Answered step by step
Verified Expert Solution
Question
1 Approved Answer
Old MathJax webview please mention the excel formulas Cover SME Report Krazy's Analysis ... D E F G H Source: Statistics Canada - Small business
Old MathJax webview
please mention the excel formulas
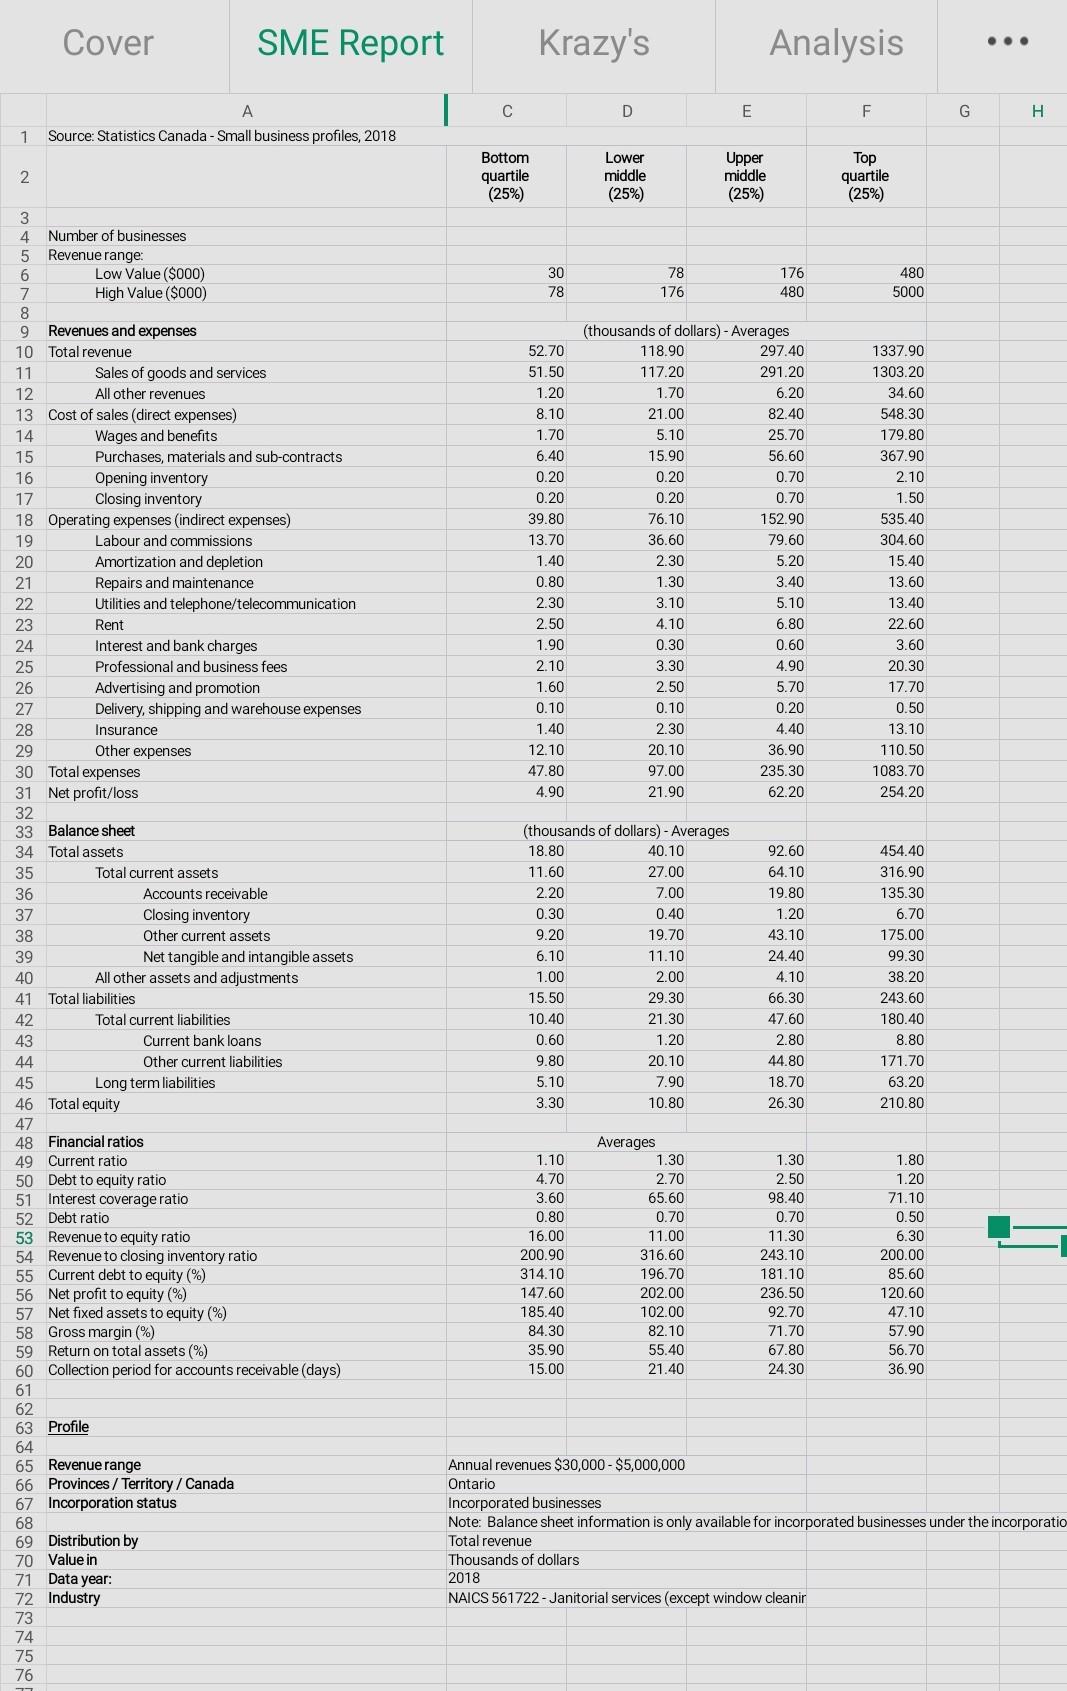
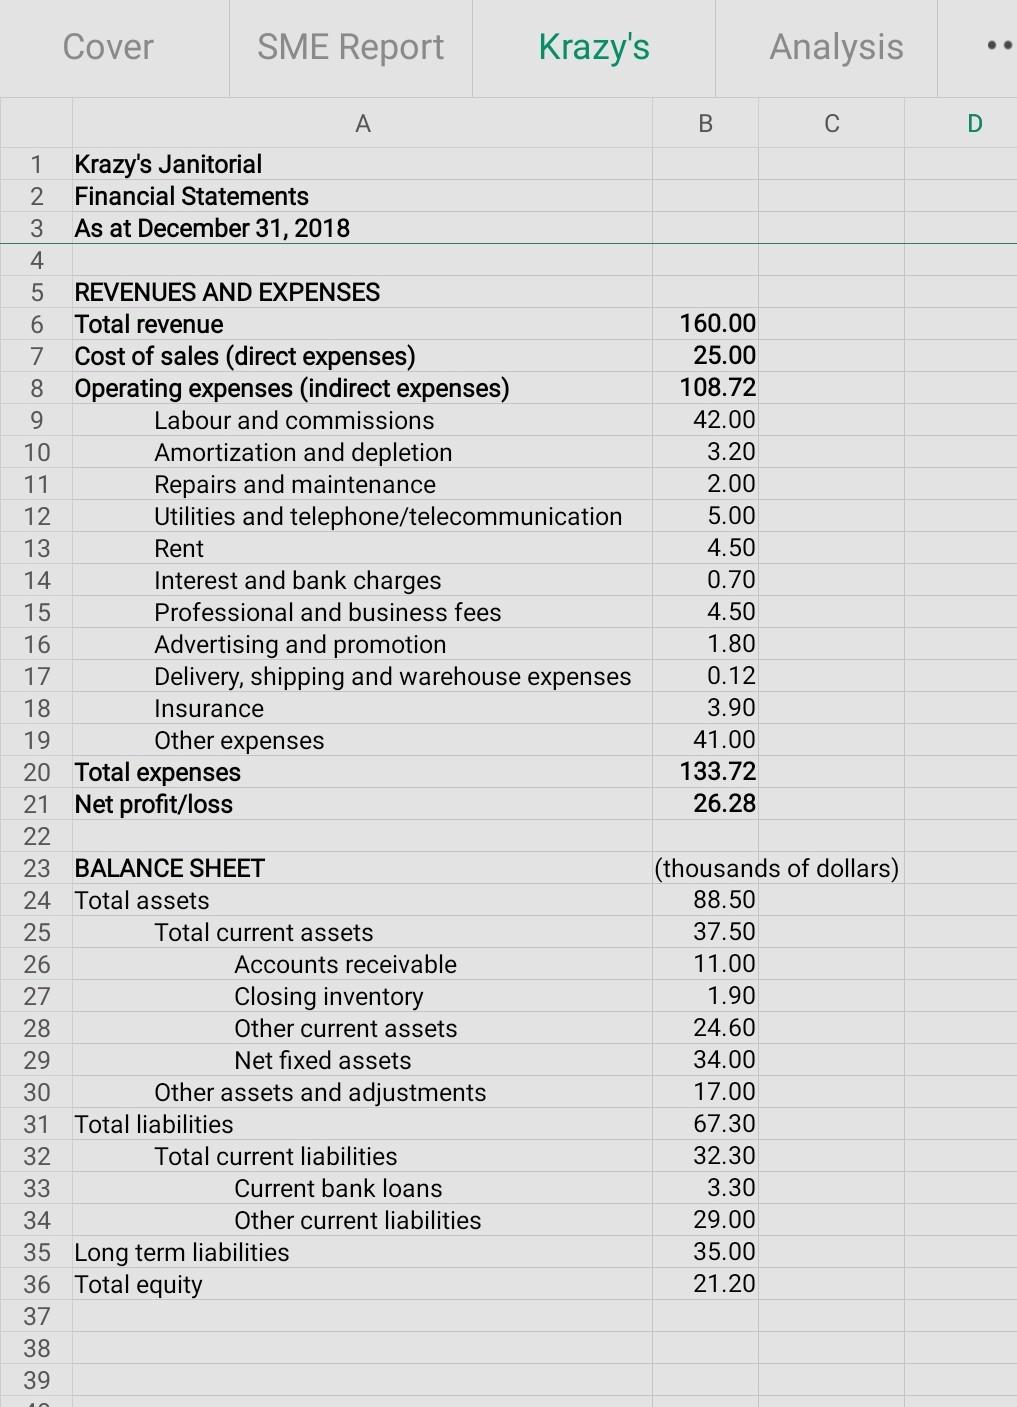
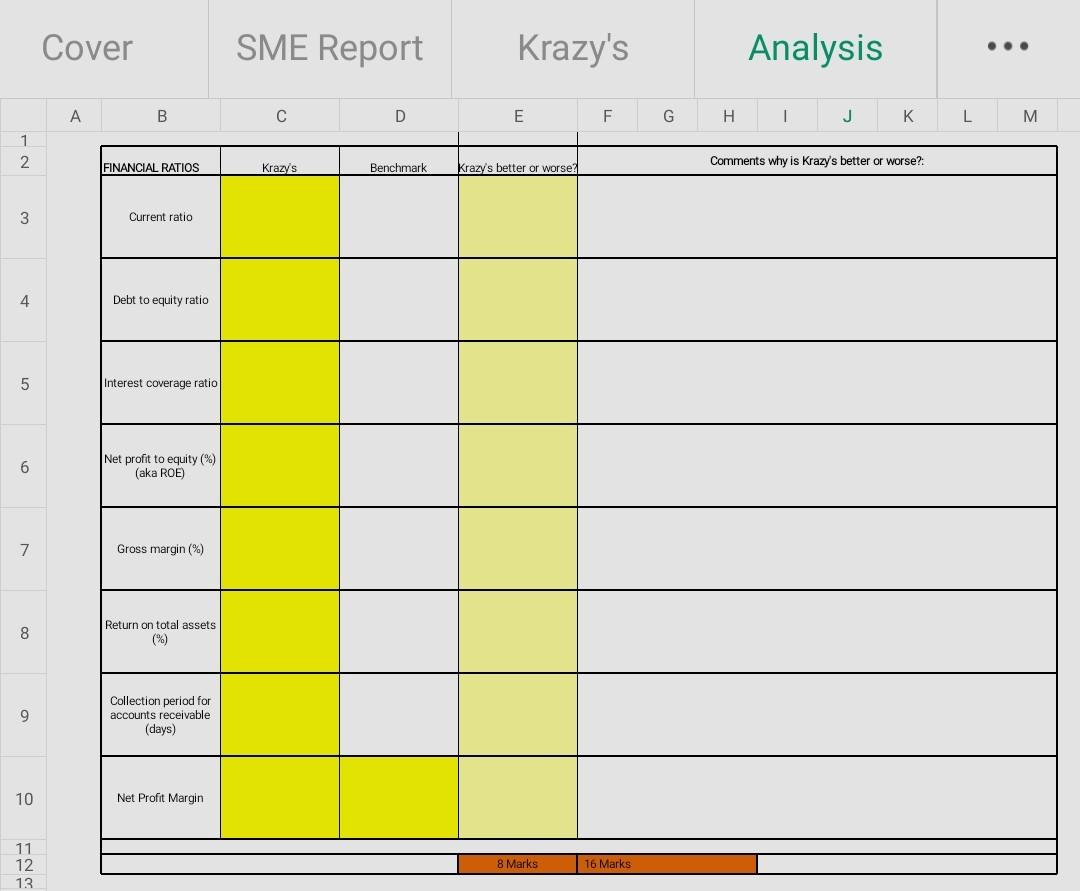
Cover SME Report Krazy's Analysis ... D E F G H Source: Statistics Canada - Small business profiles, 2018 2 Bottom quartile (25%) Lower middle (25%) Upper middle (25%) Top quartile (25%) 30 78 78 176 176 480 480 5000 1.70 52.70 51.50 1.20 8.10 1.70 6.40 0.20 0.20 39.80 13.70 1.40 0.80 2.30 2.50 1.90 2.10 1.60 0.10 1.40 12.10 47.80 4.90 (thousands of dollars) - Averages 118.90 297.40 117.20 291.20 6.20 21.00 82.40 5.10 25.70 15.90 56.60 0.20 0.70 0.20 0.70 76.10 152.90 36.60 79.60 2.30 5.20 1.30 3.40 3.10 5.10 4.10 6.80 0.30 0.60 3.30 4.90 2.50 5.70 0.10 0.20 2.30 4.40 20.10 36.90 97.00 235.30 21.90 62.20 1337.90 1303.20 34.60 548.30 179.80 367.90 2.10 1.50 535.40 304.60 15.40 13.60 13.40 22.60 3.60 20.30 17.70 0.50 13.10 110.50 1083.70 254.20 3 4 Number of businesses 5 Revenue range: 6 Low Value ($000) 7 High Value ($000) 8 9 Revenues and expenses 10 Total revenue 11 Sales of goods and services 12 All other revenues 13 Cost of sales (direct expenses) 14 Wages and benefits 15 Purchases, materials and sub-contracts 16 Opening inventory 17 Closing inventory 18 Operating expenses indirect expenses) 19 Labour and commissions 20 Amortization and depletion 21 Repairs and maintenance 22 Utilities and telephone/telecommunication 23 Rent 24 Interest and bank charges 25 Professional and business fees 26 Advertising and promotion 27 Delivery, shipping and warehouse expenses 28 Insurance 29 Other expenses 30 Total expenses 31 Net profit/loss 32 33 Balance sheet 34 Total assets 35 Total current assets 36 Accounts receivable 37 Closing inventory 38 Other current assets 39 Net tangible and intangible assets 40 All other assets and adjustments 41 Total liabilities 42 Total current liabilities 43 Current bank loans 44 Other current liabilities 45 Long term liabilities 46 Total equity 47 48 Financial ratios 49 Current ratio 50 Debt to equity ratio 51 Interest coverage ratio 52 Debt ratio 53 Revenue to equity ratio 54 Revenue to closing inventory ratio 55 Current debt to equity (%) 56 Net profit to equity (%) 57 Net fixed assets to equity (%) 58 Gross margin (%) 59 Return on total assets (%) 60 Collection period for accounts receivable (days) 61 62 63 Profile 64 65 Revenue range 66 Provinces / Territory / Canada 67 Incorporation status 68 69 Distribution by 70 Value in 71 Data year: 72 Industry 73 74 75 76 (thousands of dollars) - Averages 18.80 40.10 11.60 27.00 2.20 7.00 0.30 0.40 9.20 19.70 6.10 11.10 1.00 15.50 29.30 10.40 21.30 0.60 1.20 9.80 20.10 5.10 7.90 3.30 10.80 92.60 64.10 19.80 1.20 43.10 24.40 4.10 66.30 47.60 2.00 454.40 316.90 135.30 6.70 175.00 99.30 38.20 243.60 180.40 8.80 171.70 63.20 210.80 2.80 44.80 18.70 26.30 1.10 4.70 3.60 0.80 16.00 200.90 314.10 147.60 185.40 84.30 35.90 15.00 Averages 1.30 2.70 65.60 0.70 11.00 316.60 196.70 202.00 102.00 82.10 55.40 21.40 1.30 2.50 98.40 0.70 11.30 243.10 181.10 236.50 92.70 71.70 67.80 24.30 1.80 1.20 71.10 0.50 6.30 200.00 85.60 120.60 47.10 57.90 56.70 36.90 Annual revenues $30,000 - $5,000,000 Ontario Incorporated businesses Note: Balance sheet information is only available for incorporated businesses under the incorporatio Total revenue Thousands of dollars 2018 NAICS 561722 - Janitorial services (except window cleanir Cover SME Report Krazy's Analysis A B D 1 Krazy's Janitorial 2 Financial Statements 3 As at December 31, 2018 4 5 REVENUES AND EXPENSES 6 Total revenue 7 Cost of sales (direct expenses) 8 Operating expenses (indirect expenses) 9 Labour and commissions 10 Amortization and depletion 11 Repairs and maintenance 12 Utilities and telephone/telecommunication 13 Rent Interest and bank charges 15 Professional and business fees 16 Advertising and promotion 17 Delivery, shipping and warehouse expenses 18 Insurance 19 Other expenses 20 Total expenses 21 Net profit/loss 22 23 BALANCE SHEET 24 Total assets 25 Total current assets 26 Accounts receivable 27 Closing inventory 28 Other current assets 29 Net fixed assets 30 Other assets and adjustments 31 Total liabilities 32 Total current liabilities 33 Current bank loans 34 Other current liabilities 35 Long term liabilities 36 Total equity 37 38 39 160.00 25.00 108.72 42.00 3.20 2.00 5.00 4.50 0.70 4.50 1.80 0.12 3.90 41.00 133.72 26.28 14 (thousands of dollars) 88.50 37.50 11.00 1.90 24.60 34.00 17.00 67.30 32.30 3.30 29.00 35.00 21.20 Cover SME Report Krazy's Analysis ... A B D E F G H I J K L M 1 2 FINANCIAL RATIOS Krazy's Benchmark Comments why is Krazy's better or worse? Krazy's better or worse? 3 Current ratio 4 Debt to equity ratio 5 Interest coverage ratio 6 Net profit to equity (%) (aka ROE) 7 Gross margin (%) 8 Return on total assets (%) 9 Collection period for accounts receivable (days) 10 Net Profit Margin 11 12 13 8 Marks 16 Marks Cover SME Report Krazy's Analysis ... D E F G H Source: Statistics Canada - Small business profiles, 2018 2 Bottom quartile (25%) Lower middle (25%) Upper middle (25%) Top quartile (25%) 30 78 78 176 176 480 480 5000 1.70 52.70 51.50 1.20 8.10 1.70 6.40 0.20 0.20 39.80 13.70 1.40 0.80 2.30 2.50 1.90 2.10 1.60 0.10 1.40 12.10 47.80 4.90 (thousands of dollars) - Averages 118.90 297.40 117.20 291.20 6.20 21.00 82.40 5.10 25.70 15.90 56.60 0.20 0.70 0.20 0.70 76.10 152.90 36.60 79.60 2.30 5.20 1.30 3.40 3.10 5.10 4.10 6.80 0.30 0.60 3.30 4.90 2.50 5.70 0.10 0.20 2.30 4.40 20.10 36.90 97.00 235.30 21.90 62.20 1337.90 1303.20 34.60 548.30 179.80 367.90 2.10 1.50 535.40 304.60 15.40 13.60 13.40 22.60 3.60 20.30 17.70 0.50 13.10 110.50 1083.70 254.20 3 4 Number of businesses 5 Revenue range: 6 Low Value ($000) 7 High Value ($000) 8 9 Revenues and expenses 10 Total revenue 11 Sales of goods and services 12 All other revenues 13 Cost of sales (direct expenses) 14 Wages and benefits 15 Purchases, materials and sub-contracts 16 Opening inventory 17 Closing inventory 18 Operating expenses indirect expenses) 19 Labour and commissions 20 Amortization and depletion 21 Repairs and maintenance 22 Utilities and telephone/telecommunication 23 Rent 24 Interest and bank charges 25 Professional and business fees 26 Advertising and promotion 27 Delivery, shipping and warehouse expenses 28 Insurance 29 Other expenses 30 Total expenses 31 Net profit/loss 32 33 Balance sheet 34 Total assets 35 Total current assets 36 Accounts receivable 37 Closing inventory 38 Other current assets 39 Net tangible and intangible assets 40 All other assets and adjustments 41 Total liabilities 42 Total current liabilities 43 Current bank loans 44 Other current liabilities 45 Long term liabilities 46 Total equity 47 48 Financial ratios 49 Current ratio 50 Debt to equity ratio 51 Interest coverage ratio 52 Debt ratio 53 Revenue to equity ratio 54 Revenue to closing inventory ratio 55 Current debt to equity (%) 56 Net profit to equity (%) 57 Net fixed assets to equity (%) 58 Gross margin (%) 59 Return on total assets (%) 60 Collection period for accounts receivable (days) 61 62 63 Profile 64 65 Revenue range 66 Provinces / Territory / Canada 67 Incorporation status 68 69 Distribution by 70 Value in 71 Data year: 72 Industry 73 74 75 76 (thousands of dollars) - Averages 18.80 40.10 11.60 27.00 2.20 7.00 0.30 0.40 9.20 19.70 6.10 11.10 1.00 15.50 29.30 10.40 21.30 0.60 1.20 9.80 20.10 5.10 7.90 3.30 10.80 92.60 64.10 19.80 1.20 43.10 24.40 4.10 66.30 47.60 2.00 454.40 316.90 135.30 6.70 175.00 99.30 38.20 243.60 180.40 8.80 171.70 63.20 210.80 2.80 44.80 18.70 26.30 1.10 4.70 3.60 0.80 16.00 200.90 314.10 147.60 185.40 84.30 35.90 15.00 Averages 1.30 2.70 65.60 0.70 11.00 316.60 196.70 202.00 102.00 82.10 55.40 21.40 1.30 2.50 98.40 0.70 11.30 243.10 181.10 236.50 92.70 71.70 67.80 24.30 1.80 1.20 71.10 0.50 6.30 200.00 85.60 120.60 47.10 57.90 56.70 36.90 Annual revenues $30,000 - $5,000,000 Ontario Incorporated businesses Note: Balance sheet information is only available for incorporated businesses under the incorporatio Total revenue Thousands of dollars 2018 NAICS 561722 - Janitorial services (except window cleanir Cover SME Report Krazy's Analysis A B D 1 Krazy's Janitorial 2 Financial Statements 3 As at December 31, 2018 4 5 REVENUES AND EXPENSES 6 Total revenue 7 Cost of sales (direct expenses) 8 Operating expenses (indirect expenses) 9 Labour and commissions 10 Amortization and depletion 11 Repairs and maintenance 12 Utilities and telephone/telecommunication 13 Rent Interest and bank charges 15 Professional and business fees 16 Advertising and promotion 17 Delivery, shipping and warehouse expenses 18 Insurance 19 Other expenses 20 Total expenses 21 Net profit/loss 22 23 BALANCE SHEET 24 Total assets 25 Total current assets 26 Accounts receivable 27 Closing inventory 28 Other current assets 29 Net fixed assets 30 Other assets and adjustments 31 Total liabilities 32 Total current liabilities 33 Current bank loans 34 Other current liabilities 35 Long term liabilities 36 Total equity 37 38 39 160.00 25.00 108.72 42.00 3.20 2.00 5.00 4.50 0.70 4.50 1.80 0.12 3.90 41.00 133.72 26.28 14 (thousands of dollars) 88.50 37.50 11.00 1.90 24.60 34.00 17.00 67.30 32.30 3.30 29.00 35.00 21.20 Cover SME Report Krazy's Analysis ... A B D E F G H I J K L M 1 2 FINANCIAL RATIOS Krazy's Benchmark Comments why is Krazy's better or worse? Krazy's better or worse? 3 Current ratio 4 Debt to equity ratio 5 Interest coverage ratio 6 Net profit to equity (%) (aka ROE) 7 Gross margin (%) 8 Return on total assets (%) 9 Collection period for accounts receivable (days) 10 Net Profit Margin 11 12 13 8 Marks 16 MarksStep by Step Solution
There are 3 Steps involved in it
Step: 1

Get Instant Access to Expert-Tailored Solutions
See step-by-step solutions with expert insights and AI powered tools for academic success
Step: 2

Step: 3
Ace Your Homework with AI
Get the answers you need in no time with our AI-driven, step-by-step assistance
Get Started