Answered step by step
Verified Expert Solution
Question
1 Approved Answer
omework Saved Help Save & Exit Submit Cherk thy werts Assume that the accompanying graph depicts aggregate supply and demand conditions in an economy. Full
omework
Saved
Help
Save & Exit
Submit
Cherk thy werts
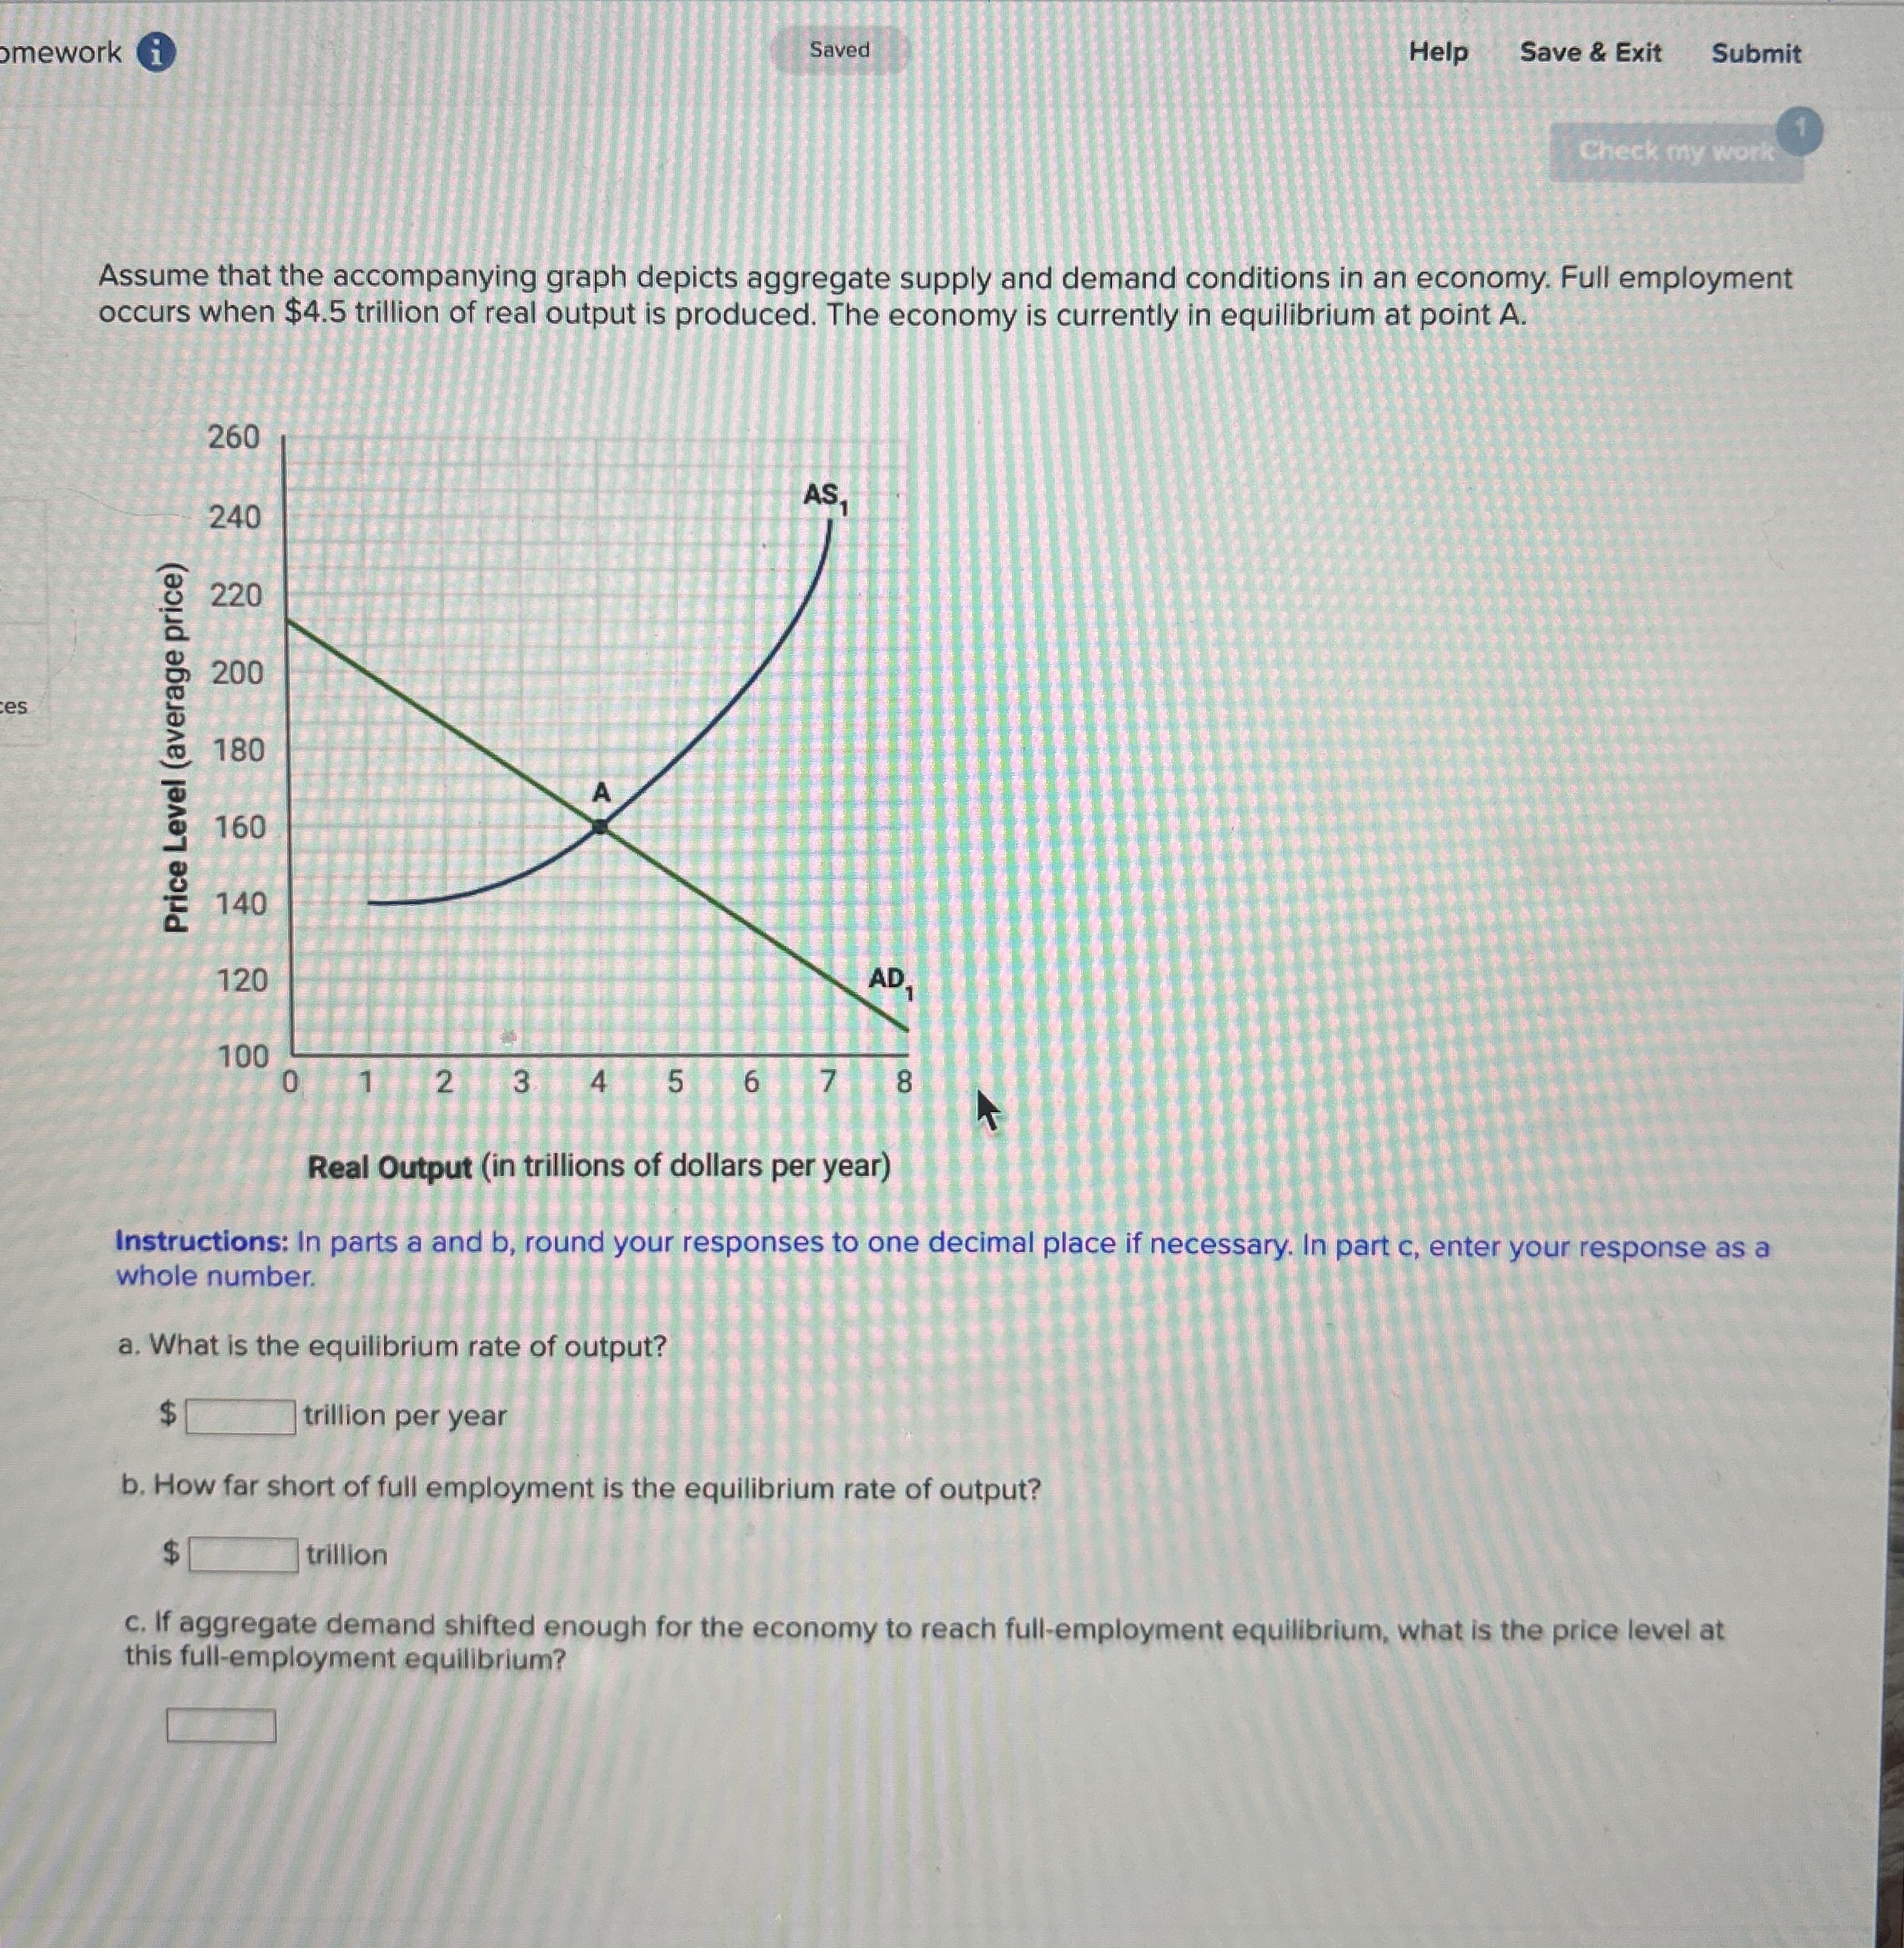
Assume that the accompanying graph depicts aggregate supply and demand conditions in an economy. Full employment occurs when $ trillion of real output is produced. The economy is currently in equilibrium at point
Keai Uutput III urimons UI colldis per year
Instructions: In parts a and b round your responses to one decimal place if necessary. In part c enter your response as a whole number.
a What is the equilibrium rate of output?
$ trillion per year
b How far short of full employment is the equilibrium rate of output?
$ trillion
c If aggregate demand shifted enough for the economy to reach fullemployment equilibrium, what is the price level at this fullemployment equilibrium?
Step by Step Solution
There are 3 Steps involved in it
Step: 1

Get Instant Access to Expert-Tailored Solutions
See step-by-step solutions with expert insights and AI powered tools for academic success
Step: 2

Step: 3
Ace Your Homework with AI
Get the answers you need in no time with our AI-driven, step-by-step assistance
Get Started